|
1900
|
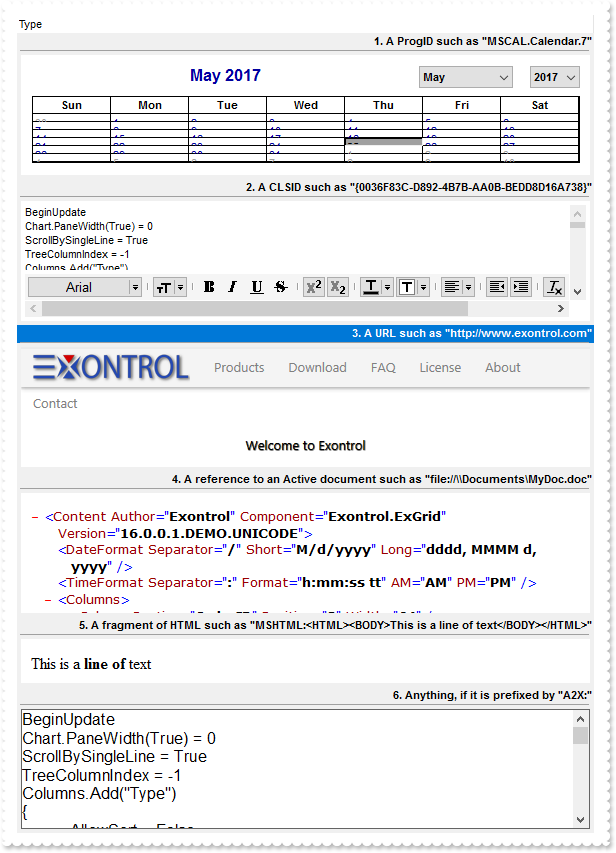
InsertControlItem / UserEditor / A2X:
Dim h as N
Dim hX as N
Dim oG2antt as P
Dim var_Calendar as local
Dim var_Chart as local
Dim var_Column as local
Dim var_ConditionalFormat as local
Dim var_Items as P

oG2antt = topparent:CONTROL_ACTIVEX1.activex
oG2antt.BeginUpdate()
oG2antt.BackColor = 15790320
' oG2antt.Chart.PaneWidth(.t.) = 0
var_Chart = oG2antt.Chart
oG2antt.TemplateDef = "dim var_Chart"
oG2antt.TemplateDef = var_Chart
oG2antt.Template = "var_Chart.PaneWidth(True) = 0"

' oG2antt.ConditionalFormats.Add("1 = 1").Bold = .t.
var_ConditionalFormat = oG2antt.ConditionalFormats.Add("1 = 1")
oG2antt.TemplateDef = "dim var_ConditionalFormat"
oG2antt.TemplateDef = var_ConditionalFormat
oG2antt.Template = "var_ConditionalFormat.Bold = True"

' oG2antt.Columns.Add("Type").Alignment = 2
var_Column = oG2antt.Columns.Add("Type")
oG2antt.TemplateDef = "dim var_Column"
oG2antt.TemplateDef = var_Column
oG2antt.Template = "var_Column.Alignment = 2"

var_Items = oG2antt.Items
	h = var_Items.AddItem("1. A ProgID such as \"MSCAL.Calendar.7\"")
	' var_Items.ItemDivider(h) = 0
	oG2antt.TemplateDef = "dim var_Items,h"
	oG2antt.TemplateDef = var_Items
	oG2antt.TemplateDef = h
	oG2antt.Template = "var_Items.ItemDivider(h) = 0"

	hX = var_Items.InsertControlItem(0,"MSCAL.Calendar","")
	' var_Items.ItemObject(hX).BackColor = 16777215
	var_Calendar = var_Items.ItemObject(hX)
	oG2antt.TemplateDef = "dim var_Calendar"
	oG2antt.TemplateDef = var_Calendar
	oG2antt.Template = "var_Calendar.BackColor = 16777215"

	h = var_Items.AddItem("2. A CLSID such as \"{0036F83C-D892-4B7B-AA0B-BEDD8D16A738}\"")
	' var_Items.ItemDivider(h) = 0
	oG2antt.TemplateDef = "dim var_Items,h"
	oG2antt.TemplateDef = var_Items
	oG2antt.TemplateDef = h
	oG2antt.Template = "var_Items.ItemDivider(h) = 0"

	hX = var_Items.InsertControlItem(0,"{0036F83C-D892-4B7B-AA0B-BEDD8D16A738}","")
	h = var_Items.AddItem("3. A URL such as \"http://www.exontrol.com\"")
	' var_Items.ItemDivider(h) = 0
	oG2antt.TemplateDef = "dim var_Items,h"
	oG2antt.TemplateDef = var_Items
	oG2antt.TemplateDef = h
	oG2antt.Template = "var_Items.ItemDivider(h) = 0"

	hX = var_Items.InsertControlItem(0,"http://www.exontrol.com","")
	h = var_Items.AddItem("4. A reference to an Active document such as \"file://\\Documents\MyDoc.doc\"")
	' var_Items.ItemDivider(h) = 0
	oG2antt.TemplateDef = "dim var_Items,h"
	oG2antt.TemplateDef = var_Items
	oG2antt.TemplateDef = h
	oG2antt.Template = "var_Items.ItemDivider(h) = 0"

	hX = var_Items.InsertControlItem(0,"file://C:\empesting.xml","")
	h = var_Items.AddItem("5.A fragment of HTML such as \"MSHTML:<HTML><BODY>This is a line of text</BODY></HTML>\"")
	' var_Items.ItemDivider(h) = 0
	oG2antt.TemplateDef = "dim var_Items,h"
	oG2antt.TemplateDef = var_Items
	oG2antt.TemplateDef = h
	oG2antt.Template = "var_Items.ItemDivider(h) = 0"

	hX = var_Items.InsertControlItem(0,"MSHTML:<HTML><BODY>This is a <b>line of</b> text</BODY></HTML>","")
	' var_Items.ItemHeight(hX) = 56
	oG2antt.TemplateDef = "dim var_Items,hX"
	oG2antt.TemplateDef = var_Items
	oG2antt.TemplateDef = hX
	oG2antt.Template = "var_Items.ItemHeight(hX) = 56"

	h = var_Items.AddItem("6.Anything, if it is preffixed by \"A2X:\"")
	' var_Items.ItemDivider(h) = 0
	oG2antt.TemplateDef = "dim var_Items,h"
	oG2antt.TemplateDef = var_Items
	oG2antt.TemplateDef = h
	oG2antt.Template = "var_Items.ItemDivider(h) = 0"

	hX = var_Items.InsertControlItem(0,"A2X:TOC24.Toc24Ctrl.1","")
oG2antt.EndUpdate()
|
|
1899
|
How do I add a RichTextBox editor
' Occurs when an user editor fires an event.
function UserEditorOleEvent as v (Object  as  P, Ev  as  OLE::Exontrol.G2antt.1::IOleEvent, CloseEditor  as  L, Item  as  OLE::Exontrol.G2antt.1::HITEM, ColIndex  as  N)
	oG2antt = topparent:CONTROL_ACTIVEX1.activex
	? Ev
end function

Dim oG2antt as P
Dim var_Editor as P
Dim var_Items as P
Dim var_RichTextBox as P

oG2antt = topparent:CONTROL_ACTIVEX1.activex
oG2antt.BeginUpdate()
oG2antt.DrawGridLines = -1
oG2antt.DefaultItemHeight = 32
var_Editor = oG2antt.Columns.Add("RICHTEXT").Editor
	var_Editor.EditType = 16
	var_Editor.UserEditor("RICHTEXT.RichtextCtrl","")
	var_RichTextBox = var_Editor.UserEditorObject
		var_RichTextBox.AutoVerbMenu = .t.
		var_RichTextBox.TextRTF = "{\rtf1\ansi{\fonttbl\f0\fswiss Helvetica;}\f0\pard\r\nThis is some {\b bold} text.\par\r\n}"
var_Items = oG2antt.Items
	var_Items.AddItem("RICHTEXT.RichtextCtrl")
oG2antt.EndUpdate()
|
|
1898
|
Is it possible to trap a double-click event on a specific cell and when that happens, to set the cell to a specific value
' Occurs when the user dblclk the left mouse button over an object.
function DblClick as v (Shift  as  N, X  as  OLE::Exontrol.G2antt.1::OLE_XPOS_PIXELS, Y  as  OLE::Exontrol.G2antt.1::OLE_YPOS_PIXELS)
	Dim h as N
	oG2antt = topparent:CONTROL_ACTIVEX1.activex
	h = oG2antt.ItemFromPoint(-1,-1,c,hit)
	? oG2antt.Items.CellValue(h,c)
end function

Dim oG2antt as P
Dim var_Items as P

oG2antt = topparent:CONTROL_ACTIVEX1.activex
oG2antt.BeginUpdate()
oG2antt.HeaderAppearance = 4
oG2antt.DrawGridLines = -2
oG2antt.Columns.Add("C1")
oG2antt.Columns.Add("C2")
var_Items = oG2antt.Items
	' var_Items.CellValue(var_Items.AddItem("Item 1"),1) = "Item 2"
	oG2antt.TemplateDef = "dim var_Items"
	oG2antt.TemplateDef = var_Items
	oG2antt.Template = "var_Items.CellValue(AddItem(`Item 1`),1) = `Item 2`"

	' var_Items.CellValue(var_Items.AddItem("Item 3"),1) = "Item 4"
	oG2antt.TemplateDef = "dim var_Items"
	oG2antt.TemplateDef = var_Items
	oG2antt.Template = "var_Items.CellValue(AddItem(`Item 3`),1) = `Item 4`"

	' var_Items.CellValue(var_Items.AddItem("Item 5"),1) = "Item 6"
	oG2antt.TemplateDef = "dim var_Items"
	oG2antt.TemplateDef = var_Items
	oG2antt.Template = "var_Items.CellValue(AddItem(`Item 5`),1) = `Item 6`"

oG2antt.EndUpdate()
|
|
1897
|
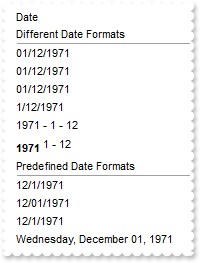
How can I display dates in DD/MM/YYYY format
Dim h as N
Dim oG2antt as P
Dim var_Items as P

oG2antt = topparent:CONTROL_ACTIVEX1.activex
oG2antt.BeginUpdate()
oG2antt.ScrollBySingleLine = .f.
oG2antt.Columns.Add("Date")
var_Items = oG2antt.Items
	' var_Items.ItemDivider(var_Items.AddItem("Different Date Formats")) = 0
	oG2antt.TemplateDef = "dim var_Items"
	oG2antt.TemplateDef = var_Items
	oG2antt.Template = "var_Items.ItemDivider(AddItem(`Different Date Formats`)) = 0"

	' var_Items.FormatCell(var_Items.AddItem({12/01/1971}),0) = "((shortdateF(value) mid 4) left 2) + `/` + (shortdateF (value) left 2) + `/` + (shortdateF (value) right 4)"
	oG2antt.TemplateDef = "dim var_Items"
	oG2antt.TemplateDef = var_Items
	oG2antt.Template = "var_Items.FormatCell(AddItem(#12/1/1971#),0) = `((shortdateF(value) mid 4) left 2) + ``/`` + (shortdateF (value) left 2) + ``/`` + (shortdateF (value) right 4)`"

	' var_Items.FormatCell(var_Items.AddItem({12/01/1971}),0) = "(1 array (0:=(shortdateF(value) split `/`))) + `/` + (0 array (=:0) ) + `/` + (2 array (=:0) )"
	oG2antt.TemplateDef = "dim var_Items"
	oG2antt.TemplateDef = var_Items
	oG2antt.Template = "var_Items.FormatCell(AddItem(#12/1/1971#),0) = `(1 array (0:=(shortdateF(value) split ``/``))) + ``/`` + (0 array (=:0) ) + ``/`` + (2 array (=:0) )`"

	' var_Items.FormatCell(var_Items.AddItem({12/01/1971}),0) = "((`0` + day(value) ) right 2) + `/` + ((`0` + month(value) ) right 2) + `/` + year(value)"
	oG2antt.TemplateDef = "dim var_Items"
	oG2antt.TemplateDef = var_Items
	oG2antt.Template = "var_Items.FormatCell(AddItem(#12/1/1971#),0) = `((``0`` + day(value) ) right 2) + ``/`` + ((``0`` + month(value) ) right 2) + ``/`` + year(value)`"

	' var_Items.FormatCell(var_Items.AddItem({12/01/1971}),0) = "day(value) + `/` + month(value) + `/` + year(value)"
	oG2antt.TemplateDef = "dim var_Items"
	oG2antt.TemplateDef = var_Items
	oG2antt.Template = "var_Items.FormatCell(AddItem(#12/1/1971#),0) = `day(value) + ``/`` + month(value) + ``/`` + year(value)`"

	' var_Items.FormatCell(var_Items.AddItem({12/01/1971}),0) = "year(value) + ` - ` + day(value) + ` - ` + month(value)"
	oG2antt.TemplateDef = "dim var_Items"
	oG2antt.TemplateDef = var_Items
	oG2antt.Template = "var_Items.FormatCell(AddItem(#12/1/1971#),0) = `year(value) + `` - `` + day(value) + `` - `` + month(value)`"

	h = var_Items.AddItem({12/01/1971})
	' var_Items.ItemHeight(h) = 24
	oG2antt.TemplateDef = "dim var_Items,h"
	oG2antt.TemplateDef = var_Items
	oG2antt.TemplateDef = h
	oG2antt.Template = "var_Items.ItemHeight(h) = 24"

	' var_Items.CellValueFormat(h,0) = 1
	oG2antt.TemplateDef = "dim var_Items,h"
	oG2antt.TemplateDef = var_Items
	oG2antt.TemplateDef = h
	oG2antt.Template = "var_Items.CellValueFormat(h,0) = 1"

	' var_Items.FormatCell(h,0) = "`<b>` + year(value) + `</b><off -4> ` + day(value) + ` - ` + month(value)"
	oG2antt.TemplateDef = "dim var_Items,h"
	oG2antt.TemplateDef = var_Items
	oG2antt.TemplateDef = h
	oG2antt.Template = "var_Items.FormatCell(h,0) = ```<b>`` + year(value) + ``</b><off -4> `` + day(value) + `` - `` + month(value)`"

	' var_Items.ItemDivider(var_Items.AddItem("Predefined Date Formats")) = 0
	oG2antt.TemplateDef = "dim var_Items"
	oG2antt.TemplateDef = var_Items
	oG2antt.Template = "var_Items.ItemDivider(AddItem(`Predefined Date Formats`)) = 0"

	' var_Items.FormatCell(var_Items.AddItem({12/01/1971}),0) = "value"
	oG2antt.TemplateDef = "dim var_Items"
	oG2antt.TemplateDef = var_Items
	oG2antt.Template = "var_Items.FormatCell(AddItem(#12/1/1971#),0) = `value`"

	' var_Items.FormatCell(var_Items.AddItem({12/01/1971}),0) = "shortdateF(value)"
	oG2antt.TemplateDef = "dim var_Items"
	oG2antt.TemplateDef = var_Items
	oG2antt.Template = "var_Items.FormatCell(AddItem(#12/1/1971#),0) = `shortdateF(value)`"

	' var_Items.FormatCell(var_Items.AddItem({12/01/1971}),0) = "shortdate(value)"
	oG2antt.TemplateDef = "dim var_Items"
	oG2antt.TemplateDef = var_Items
	oG2antt.Template = "var_Items.FormatCell(AddItem(#12/1/1971#),0) = `shortdate(value)`"

	' var_Items.FormatCell(var_Items.AddItem({12/01/1971}),0) = "longdate(value)"
	oG2antt.TemplateDef = "dim var_Items"
	oG2antt.TemplateDef = var_Items
	oG2antt.Template = "var_Items.FormatCell(AddItem(#12/1/1971#),0) = `longdate(value)`"

oG2antt.EndUpdate()
|
|
1896
|
I have noticed that the column gets resized once I release the mouse. I have a column that displays multiple-lines cells, and the text gets wrapped only when user releases the mouse. Is it possible to get resized contiguously as I had before
Dim oG2antt as P
Dim var_Column as local
Dim var_Column1 as local

oG2antt = topparent:CONTROL_ACTIVEX1.activex
oG2antt.BeginUpdate()
oG2antt.ScrollBySingleLine = .f.
oG2antt.DrawGridLines = 2
oG2antt.ColumnsAllowSizing = .t.
' oG2antt.Columns.Add("Column A (cont)").Def(64) = .t.
var_Column = oG2antt.Columns.Add("Column A (cont)")
oG2antt.TemplateDef = "dim var_Column"
oG2antt.TemplateDef = var_Column
oG2antt.Template = "var_Column.Def(64) = True"

oG2antt.Columns.Add("Column 1")
' oG2antt.Columns.Add("Column B (cont)").Def(64) = .t.
var_Column1 = oG2antt.Columns.Add("Column B (cont)")
oG2antt.TemplateDef = "dim var_Column1"
oG2antt.TemplateDef = var_Column1
oG2antt.Template = "var_Column1.Def(64) = True"

oG2antt.Columns.Add("Column 2")
oG2antt.EndUpdate()
|
|
1895
|
How do I get the column from cursor, when it hovers the empty portion of the items section
' Occurs when the user moves the mouse.
function MouseMove as v (Button  as  N, Shift  as  N, X  as  OLE::Exontrol.G2antt.1::OLE_XPOS_PIXELS, Y  as  OLE::Exontrol.G2antt.1::OLE_YPOS_PIXELS)
	Dim i as N
	oG2antt = topparent:CONTROL_ACTIVEX1.activex
	i = oG2antt.ItemFromPoint(0,-1,c,hit)
	? "Column"
	? c
end function

Dim oG2antt as P

oG2antt = topparent:CONTROL_ACTIVEX1.activex
oG2antt.BeginUpdate()
oG2antt.DrawGridLines = 2
oG2antt.Columns.Add("Column 0")
oG2antt.Columns.Add("Column 1")
oG2antt.Columns.Add("Column 2")
oG2antt.EndUpdate()
|
|
1894
|
How do I add items once the user clicks the empty area
' Occurs when the user presses and then releases the left mouse button over the tree control.
function Click as v ()
	Dim i as N
	Dim var_Items as P
	oG2antt = topparent:CONTROL_ACTIVEX1.activex
	i = oG2antt.ItemFromPoint(0,-1,c,hit)
	var_Items = oG2antt.Items
		' var_Items.CellValue(var_Items.AddItem(i),1) = c
		oG2antt.TemplateDef = "dim var_Items"
		oG2antt.TemplateDef = var_Items
		oG2antt.Template = "var_Items.CellValue(AddItem(i),1) = c"

end function

Dim oG2antt as P

oG2antt = topparent:CONTROL_ACTIVEX1.activex
oG2antt.BeginUpdate()
oG2antt.Columns.Add("Number of Items to Add")
oG2antt.Columns.Add("Click on Column")
oG2antt.EndUpdate()
|
|
1893
|
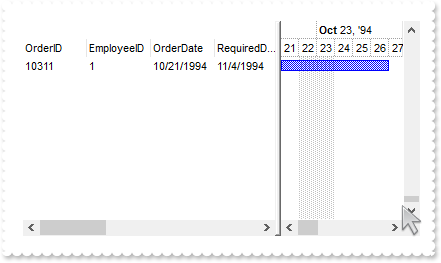
Is there an easy way to get an effect like in a Microsoft Access / SQL-Server Table view, where you can scroll-up till the last row containing data is displayed as top-row
' Occurs after a new Item has been inserted to Items collection.
function AddItem as v (Item  as  OLE::Exontrol.G2antt.1::HITEM)
	Dim var_Items as P
	oG2antt = topparent:CONTROL_ACTIVEX1.activex
	var_Items = oG2antt.Items
		var_Items.AddBar(Item,"Task",var_Items.CellValue(Item,2),var_Items.CellValue(Item,4))
end function

Dim oG2antt as P
Dim rs as P
Dim var_Chart as P

oG2antt = topparent:CONTROL_ACTIVEX1.activex
oG2antt.BeginUpdate()
oG2antt.HasLines = 0
oG2antt.ColumnAutoResize = .f.
rs = OLE.Create("ADOR.Recordset")
	rs.Open("Orders","Provider=Microsoft.ACE.OLEDB.12.0;Data Source=C:\Program Files\Exontrol\ExG2antt\Sample\Access\misc.accdb",1,1)
var_Chart = oG2antt.Chart
	var_Chart.FirstVisibleDate = {10/21/1994}
	var_Chart.LevelCount = 2
oG2antt.DataSource = rs
oG2antt.ScrollBars = 2051 'exVScrollEmptySpace + exBoth
oG2antt.Template = "ScrollPos(True) = Items.ItemCount" // oG2antt.ScrollPos(.t.) = oG2antt.Items.ItemCount
oG2antt.EndUpdate()
|
|
1892
|
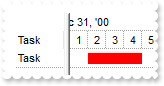
Is there any option to stop events
' Occurs after a new Item has been inserted to Items collection.
function AddItem as v (Item  as  OLE::Exontrol.G2antt.1::HITEM)
	oG2antt = topparent:CONTROL_ACTIVEX1.activex
	? "AddItem event is fired only if FreezeEvents(False) is called"
end function

' Occurs when the user links two bars using the mouse.
function AddLink as v (LinkKey  as  C)
	oG2antt = topparent:CONTROL_ACTIVEX1.activex
	? "AddLink event is fired only if FreezeEvents(False) is called"
end function

' Occurs when a bar is moved or resized.
function BarResize as v (Item  as  OLE::Exontrol.G2antt.1::HITEM, Key  as  A)
	oG2antt = topparent:CONTROL_ACTIVEX1.activex
	? "BarResize event is fired only if FreezeEvents(False) is called"
end function

Dim h1 as N
Dim h2 as N
Dim oG2antt as P
Dim var_Chart as P
Dim var_Items as P

oG2antt = topparent:CONTROL_ACTIVEX1.activex
oG2antt.FreezeEvents(.t.)
oG2antt.BeginUpdate()
oG2antt.DefaultItemHeight = 24
oG2antt.Columns.Add("Task")
var_Chart = oG2antt.Chart
	var_Chart.LevelCount = 2
	var_Chart.FirstVisibleDate = {01/01/2001}
	' var_Chart.PaneWidth(.f.) = 48
	oG2antt.TemplateDef = "dim var_Chart"
	oG2antt.TemplateDef = var_Chart
	oG2antt.Template = "var_Chart.PaneWidth(False) = 48"

var_Items = oG2antt.Items
	h1 = var_Items.AddItem("Task 1")
	var_Items.AddBar(h1,"Task",{01/02/2001},{01/04/2001},"")
	h2 = var_Items.AddItem("Task 2")
	var_Items.AddBar(h2,"Task",{01/02/2001},{01/04/2001},"")
	var_Items.AddLink("L1",h1,"",h2,"")
	var_Items.SchedulePDM(0,"")
oG2antt.EndUpdate()
oG2antt.FreezeEvents(.f.)
|
|
1891
|
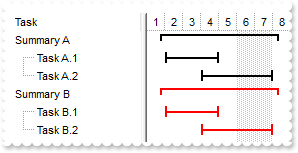
How do I specify a more intensive color if using RenderType property
Dim hSummaryJ as N
Dim hSummaryK as N
Dim hTaskJ as N
Dim hTaskK as N
Dim oG2antt as P
Dim var_Appearance as P
Dim var_Bar as P
Dim var_Bar1 as P
Dim var_Chart as P
Dim var_Items as P

oG2antt = topparent:CONTROL_ACTIVEX1.activex
oG2antt.BeginUpdate()
var_Appearance = oG2antt.VisualAppearance
	var_Appearance.RenderType = -16777216
	var_Appearance.Add(1,"gBFLBCJwBAEHhEJAAEhABN0GACAADACAxRDAMgBQKAAzQFAYahuGSGAAGMYxQgmFgAQhFcZQSKUOQTDKMIziYBYJhEMQyDAAUIjOKsIhkGYcZAGQBJCjWGodQLOEgwHIERQjEyUJAGGQIHhyPYbUbGUpQHKkeRtGqgBgoKhKEouNYgAbGYIwTRsdyfDSXBpEWwbDgkNQwWTDNoRDIUQStCysaYjOpnfrUAJ1P7FdQ1NJkXRhGSSK7maapaiCSZ6STCMj1FhVKSNJ7DQKhGpgKh/ApgYpQOK4fLNXyRBK4QAyKA6bgPFZOZbFViaXY1V5bNKrcjhHQwAyHJ4XXRdV4YRAkUT4GqiJKGSYcQhuXZWbRqO6ABhef6DRThc6jKpFHIE4llEcojHqSZNgoIxnlgd5thsLREleL43gsYZ9BkaAYkMAgAm+CxGDWWAtiKCRfjcdRgHoHYnicUwgAIEIREAaQYkcQZUHIGRUDQJBOEYRAhDYCxGgMZAkCgdYQhaXQIAYERwQuahXggdgeG6VZ4H4IhdiIGIOB8YIiGiHZZgqYpGF4KYHiKCI+CAU5jCiTQ2g0YhEFyax4gABAEIC")
	var_Appearance.Add(2,"gBFLBCJwBAEHhEJAAEhABU0IQAAYAQGKQYhiAKBQAGaAoDDcMA4QwAAyjAKMEwsACEIrjKCRShyCYZRhGcTAJBMIhiGQYAChEZxVhEMgzDjIAxSJAcQRFESaAABGCQGh+N4/S4NIi0CIsZQjCaiZ7pKA5bgMCo+UrNMixZQVCSOGChYRpCaZWpGGodQRUFbVHAlKypJKCKrEWSrDhuYAAW7XM7yBS1TzVNSuLZtaLqSroAJ1WTWMB0Ra8NzZEKfaZACj4arKejrRDCMAggI=")
oG2antt.Columns.Add("Task")
var_Chart = oG2antt.Chart
	' var_Chart.PaneWidth(.f.) = 128
	oG2antt.TemplateDef = "dim var_Chart"
	oG2antt.TemplateDef = var_Chart
	oG2antt.Template = "var_Chart.PaneWidth(False) = 128"

	var_Chart.FirstVisibleDate = {01/01/2001}
	var_Bar = var_Chart.Bars.Item("Task")
		' var_Bar.Def(4) = 18
		oG2antt.TemplateDef = "dim var_Bar"
		oG2antt.TemplateDef = var_Bar
		oG2antt.Template = "var_Bar.Def(4) = 18"

		var_Bar.Color = 16777216
	var_Bar1 = var_Chart.Bars.Item("Summary")
		' var_Bar1.Def(4) = 18
		oG2antt.TemplateDef = "dim var_Bar1"
		oG2antt.TemplateDef = var_Bar1
		oG2antt.Template = "var_Bar1.Def(4) = 18"

		var_Bar1.Color = 33554432
var_Items = oG2antt.Items
	hSummaryJ = var_Items.AddItem("Summary A")
	var_Items.AddBar(hSummaryJ,"Summary",{01/02/2001},{01/02/2001},"J")
	hTaskJ = var_Items.InsertItem(hSummaryJ,,"Task A.1")
	var_Items.AddBar(hTaskJ,"Task",{01/02/2001},{01/05/2001},"J1")
	hTaskJ = var_Items.InsertItem(hSummaryJ,,"Task A.2")
	var_Items.AddBar(hTaskJ,"Task",{01/04/2001},{01/08/2001},"J2")
	var_Items.DefineSummaryBars(hSummaryJ,"J",-1,"<*>")
	hSummaryK = var_Items.AddItem("Summary B")
	var_Items.AddBar(hSummaryK,"Summary",{01/02/2001},{01/02/2001},"K")
	hTaskK = var_Items.InsertItem(hSummaryK,,"Task B.1")
	var_Items.AddBar(hTaskK,"Task",{01/02/2001},{01/05/2001},"K1")
	hTaskK = var_Items.InsertItem(hSummaryK,,"Task B.2")
	var_Items.AddBar(hTaskK,"Task",{01/04/2001},{01/08/2001},"K2")
	var_Items.DefineSummaryBars(hSummaryK,"K",-1,"<*>")
	' var_Items.ItemBar(0,"<K*>",33) = 255
	oG2antt.TemplateDef = "dim var_Items"
	oG2antt.TemplateDef = var_Items
	oG2antt.Template = "var_Items.ItemBar(0,`<K*>`,33) = 255"

	' var_Items.ExpandItem(0) = .t.
	oG2antt.TemplateDef = "dim var_Items"
	oG2antt.TemplateDef = var_Items
	oG2antt.Template = "var_Items.ExpandItem(0) = True"

oG2antt.EndUpdate()
|
|
1890
|
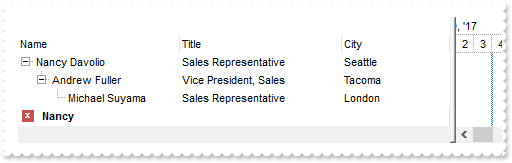
How can I include the child items, when a filter is applied
Dim h0 as N
Dim oG2antt as P
Dim var_Column as local
Dim var_Column1 as local
Dim var_Columns as P
Dim var_Items as P

oG2antt = topparent:CONTROL_ACTIVEX1.activex
oG2antt.BeginUpdate()
oG2antt.ColumnAutoResize = .t.
oG2antt.ContinueColumnScroll = .f.
oG2antt.MarkSearchColumn = .f.
oG2antt.SearchColumnIndex = 1
oG2antt.Indent = 16
oG2antt.LinesAtRoot = -1
oG2antt.FilterBarPromptVisible = .t.
oG2antt.FilterBarPromptPattern = "Nancy"
oG2antt.FilterInclude = 1
oG2antt.Chart.LevelCount = 2
var_Columns = oG2antt.Columns
	' var_Columns.Add("Name").Width = 96
	var_Column = var_Columns.Add("Name")
	oG2antt.TemplateDef = "dim var_Column"
	oG2antt.TemplateDef = var_Column
	oG2antt.Template = "var_Column.Width = 96"

	' var_Columns.Add("Title").Width = 96
	var_Column1 = var_Columns.Add("Title")
	oG2antt.TemplateDef = "dim var_Column1"
	oG2antt.TemplateDef = var_Column1
	oG2antt.Template = "var_Column1.Width = 96"

	var_Columns.Add("City")
var_Items = oG2antt.Items
	h0 = var_Items.AddItem("Nancy Davolio")
	' var_Items.CellValue(h0,1) = "Sales Representative"
	oG2antt.TemplateDef = "dim var_Items,h0"
	oG2antt.TemplateDef = var_Items
	oG2antt.TemplateDef = h0
	oG2antt.Template = "var_Items.CellValue(h0,1) = `Sales Representative`"

	' var_Items.CellValue(h0,2) = "Seattle"
	oG2antt.TemplateDef = "dim var_Items,h0"
	oG2antt.TemplateDef = var_Items
	oG2antt.TemplateDef = h0
	oG2antt.Template = "var_Items.CellValue(h0,2) = `Seattle`"

	h0 = var_Items.InsertItem(h0,,"Andrew Fuller")
	' var_Items.CellValue(h0,1) = "Vice President, Sales"
	oG2antt.TemplateDef = "dim var_Items,h0"
	oG2antt.TemplateDef = var_Items
	oG2antt.TemplateDef = h0
	oG2antt.Template = "var_Items.CellValue(h0,1) = `Vice President, Sales`"

	' var_Items.CellValue(h0,2) = "Tacoma"
	oG2antt.TemplateDef = "dim var_Items,h0"
	oG2antt.TemplateDef = var_Items
	oG2antt.TemplateDef = h0
	oG2antt.Template = "var_Items.CellValue(h0,2) = `Tacoma`"

	h0 = var_Items.InsertItem(h0,,"Michael Suyama")
	' var_Items.CellValue(h0,1) = "Sales Representative"
	oG2antt.TemplateDef = "dim var_Items,h0"
	oG2antt.TemplateDef = var_Items
	oG2antt.TemplateDef = h0
	oG2antt.Template = "var_Items.CellValue(h0,1) = `Sales Representative`"

	' var_Items.CellValue(h0,2) = "London"
	oG2antt.TemplateDef = "dim var_Items,h0"
	oG2antt.TemplateDef = var_Items
	oG2antt.TemplateDef = h0
	oG2antt.Template = "var_Items.CellValue(h0,2) = `London`"

	h0 = var_Items.AddItem("Janet Leverling")
	' var_Items.CellValue(h0,1) = "Sales Representative"
	oG2antt.TemplateDef = "dim var_Items,h0"
	oG2antt.TemplateDef = var_Items
	oG2antt.TemplateDef = h0
	oG2antt.Template = "var_Items.CellValue(h0,1) = `Sales Representative`"

	' var_Items.CellValue(h0,2) = "Kirkland"
	oG2antt.TemplateDef = "dim var_Items,h0"
	oG2antt.TemplateDef = var_Items
	oG2antt.TemplateDef = h0
	oG2antt.Template = "var_Items.CellValue(h0,2) = `Kirkland`"

	h0 = var_Items.InsertItem(h0,,"Margaret Peacock")
	' var_Items.CellValue(h0,1) = "Sales Representative"
	oG2antt.TemplateDef = "dim var_Items,h0"
	oG2antt.TemplateDef = var_Items
	oG2antt.TemplateDef = h0
	oG2antt.Template = "var_Items.CellValue(h0,1) = `Sales Representative`"

	' var_Items.CellValue(h0,2) = "Redmond"
	oG2antt.TemplateDef = "dim var_Items,h0"
	oG2antt.TemplateDef = var_Items
	oG2antt.TemplateDef = h0
	oG2antt.Template = "var_Items.CellValue(h0,2) = `Redmond`"

	' var_Items.ExpandItem(0) = .t.
	oG2antt.TemplateDef = "dim var_Items"
	oG2antt.TemplateDef = var_Items
	oG2antt.Template = "var_Items.ExpandItem(0) = True"

oG2antt.ApplyFilter()
oG2antt.EndUpdate()
|
|
1889
|
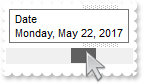
Is it possible to change the date format shown when you scroll the horizontal bar on the chart
Dim oG2antt as P

oG2antt = topparent:CONTROL_ACTIVEX1.activex
oG2antt.Chart.ToolTip = "<b>Date</b><br><%loc_ldate%>"
|
|
1888
|
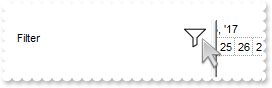
How do I change the drop down filter icon/button (white)
Dim oG2antt as P
Dim var_Appearance as P
Dim var_Chart as P
Dim var_Column as P

oG2antt = topparent:CONTROL_ACTIVEX1.activex
oG2antt.BeginUpdate()
var_Appearance = oG2antt.VisualAppearance
	var_Appearance.Add(2,"gBFLBCJwBAEHhEJAAEhABX8GACAADACAxSDEMQBQKAAzQFAYbhgHCGAAGQaBUgmFgAQhFcZQSKUOQTDKNYykCIRSDUJYkSZEIyjBI8ExXFqNACkGKwYgmNYiTLAcgANJ0WBaGIZJ4gOT5fDKMoEDRRYADFCscwxJybQAqGQKKb+VgAVY/cTyBIAEQSKA0TDOQ5TSKWB4JPZQRBEbZMNBtBIUJquKaqShdQJCU5FdY3Xblez9P7AMBwLFEC4NQ8YNYuPhjR4dRTIMhvVAsUArFh8Zg9GZZFjmDIDT4ydBLTQwcyVIKnP5qOa6XbmPoCQDYKxZHYxPzVDa3axuL76dqCAT7XrXNy1TbNRrzQKfcJqfCbdw2YaDZLOOT3fjuI4hhKaRzFAHJ+jYQ4xHuY4gHuGIXGeExqC8Tp6C+PoEm+G5ImycRgh0XwvDGa5rgOeoejyXwnFeQp2mkf5ClgBB9gCWIYAwfYAEKV58mkdwOggNArgOXY2EWLoDkKOA0mgbhOGgZApgaSBIHWSYHSmbApgYThmESZYJkIeIkgeCpfliLIHgpMIcmUYYYmODAlg2SI4mWfRfGOEguDcCRjFYAJihCQhJBSDoRmONgKEcI4kFCEJhhOVYTmYnAlEAQhWBMJYJGYWoWmWSR2F6F5lnkWAQhUAgpEieRWEuSYkjWGpmkmNhuhuZwJkYcocmaaYkjyEhngnUA6lEFAlAEgI=")
	var_Appearance.Add(1,"CP:2 -4 -4 2 4")
oG2antt.Template = "Background(0) = 16777216" // oG2antt.Background(0) = 16777216
oG2antt.Template = "Background(32) = BackColor" // oG2antt.Background(32) = oG2antt.BackColor
oG2antt.HeaderAppearance = 0
oG2antt.BackColorHeader = 16777215
oG2antt.HeaderVisible = 1
oG2antt.HeaderHeight = 24
var_Column = oG2antt.Columns.Add("Filter")
	var_Column.DisplayFilterButton = .t.
	var_Column.AllowSort = .f.
	var_Column.AllowDragging = .f.
var_Chart = oG2antt.Chart
	' var_Chart.PaneWidth(.f.) = 196
	oG2antt.TemplateDef = "dim var_Chart"
	oG2antt.TemplateDef = var_Chart
	oG2antt.Template = "var_Chart.PaneWidth(False) = 196"

	var_Chart.LevelCount = 2
oG2antt.EndUpdate()
|
|
1887
|
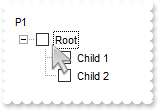
How do I prevent changing the cell's state ( check-box state )
' Fired before cell's state is about to be changed.
function CellStateChanging as v (Item  as  OLE::Exontrol.G2antt.1::HITEM, ColIndex  as  N, NewState  as  N)
	Dim var_Items as P
	oG2antt = topparent:CONTROL_ACTIVEX1.activex
	var_Items = oG2antt.Items
		NewState = var_Items.CellState(Item,ColIndex)
end function

Dim h as N
Dim oG2antt as P
Dim var_Column as P
Dim var_Column1 as P
Dim var_Items as P

oG2antt = topparent:CONTROL_ACTIVEX1.activex
oG2antt.BeginUpdate()
oG2antt.LinesAtRoot = -1
var_Column = oG2antt.Columns.Add("P1")
	' var_Column.Def(0) = .t.
	oG2antt.TemplateDef = "dim var_Column"
	oG2antt.TemplateDef = var_Column
	oG2antt.Template = "var_Column.Def(0) = True"

	var_Column.PartialCheck = .t.
var_Column1 = oG2antt.Columns.Add("P2")
	' var_Column1.Def(0) = .t.
	oG2antt.TemplateDef = "dim var_Column1"
	oG2antt.TemplateDef = var_Column1
	oG2antt.Template = "var_Column1.Def(0) = True"

	var_Column1.PartialCheck = .t.
var_Items = oG2antt.Items
	h = var_Items.AddItem("Root")
	var_Items.InsertItem(h,,"Child 1")
	var_Items.InsertItem(h,,"Child 2")
	' var_Items.ExpandItem(h) = .t.
	oG2antt.TemplateDef = "dim var_Items,h"
	oG2antt.TemplateDef = var_Items
	oG2antt.TemplateDef = h
	oG2antt.Template = "var_Items.ExpandItem(h) = True"

oG2antt.EndUpdate()
|
|
1886
|
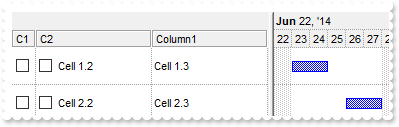
How do I change the color of the columns's header to cover all levels
Dim h as N
Dim oG2antt as P
Dim var_Chart as P
Dim var_Column as P
Dim var_Column1 as P
Dim var_Columns as P
Dim var_Items as P

oG2antt = topparent:CONTROL_ACTIVEX1.activex
oG2antt.BeginUpdate()
oG2antt.DrawGridLines = -1
oG2antt.BackColorLevelHeader = oG2antt.BackColorHeader
oG2antt.HeaderAppearance = 4
oG2antt.DefaultItemHeight = 36
oG2antt.TreeColumnIndex = -1
var_Columns = oG2antt.Columns
	var_Column = var_Columns.Add("C1")
		' var_Column.Def(0) = .t.
		oG2antt.TemplateDef = "dim var_Column"
		oG2antt.TemplateDef = var_Column
		oG2antt.Template = "var_Column.Def(0) = True"

		var_Column.Width = 24
		var_Column.AllowSizing = .f.
		' var_Column.Def(48) = 3
		oG2antt.TemplateDef = "dim var_Column"
		oG2antt.TemplateDef = var_Column
		oG2antt.Template = "var_Column.Def(48) = 3"

	var_Column1 = var_Columns.Add("C2")
		' var_Column1.Def(0) = .t.
		oG2antt.TemplateDef = "dim var_Column1"
		oG2antt.TemplateDef = var_Column1
		oG2antt.Template = "var_Column1.Def(0) = True"

		' var_Column1.Def(48) = 2
		oG2antt.TemplateDef = "dim var_Column1"
		oG2antt.TemplateDef = var_Column1
		oG2antt.Template = "var_Column1.Def(48) = 2"

	var_Columns.Add("Column1")
var_Chart = oG2antt.Chart
	var_Chart.BackColorLevelHeader = oG2antt.BackColorHeader
	var_Chart.LevelCount = 2
	var_Chart.DrawGridLines = -1
	var_Chart.FirstVisibleDate = {06/22/2014}
	' var_Chart.PaneWidth(.f.) = 256
	oG2antt.TemplateDef = "dim var_Chart"
	oG2antt.TemplateDef = var_Chart
	oG2antt.Template = "var_Chart.PaneWidth(False) = 256"

var_Items = oG2antt.Items
	h = var_Items.AddItem("")
	' var_Items.CellValue(h,1) = "Cell 1.2"
	oG2antt.TemplateDef = "dim var_Items,h"
	oG2antt.TemplateDef = var_Items
	oG2antt.TemplateDef = h
	oG2antt.Template = "var_Items.CellValue(h,1) = `Cell 1.2`"

	' var_Items.CellValue(h,2) = "Cell 1.3"
	oG2antt.TemplateDef = "dim var_Items,h"
	oG2antt.TemplateDef = var_Items
	oG2antt.TemplateDef = h
	oG2antt.Template = "var_Items.CellValue(h,2) = `Cell 1.3`"

	var_Items.AddBar(h,"Task",{06/23/2014},{06/25/2014})
	h = var_Items.AddItem("")
	' var_Items.CellValue(h,1) = "Cell 2.2"
	oG2antt.TemplateDef = "dim var_Items,h"
	oG2antt.TemplateDef = var_Items
	oG2antt.TemplateDef = h
	oG2antt.Template = "var_Items.CellValue(h,1) = `Cell 2.2`"

	' var_Items.CellValue(h,2) = "Cell 2.3"
	oG2antt.TemplateDef = "dim var_Items,h"
	oG2antt.TemplateDef = var_Items
	oG2antt.TemplateDef = h
	oG2antt.Template = "var_Items.CellValue(h,2) = `Cell 2.3`"

	var_Items.AddBar(h,"Task",{06/26/2014},{06/28/2014})
oG2antt.EndUpdate()
|
|
1885
|
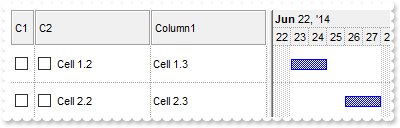
Is it possible to extend the columns's header to fill all levels
Dim h as N
Dim oG2antt as P
Dim var_Chart as P
Dim var_Column as P
Dim var_Column1 as P
Dim var_Columns as P
Dim var_Items as P

oG2antt = topparent:CONTROL_ACTIVEX1.activex
oG2antt.BeginUpdate()
oG2antt.DrawGridLines = -1
oG2antt.HeaderVisible = 1
oG2antt.HeaderAppearance = 4
oG2antt.DefaultItemHeight = 36
oG2antt.TreeColumnIndex = -1
var_Columns = oG2antt.Columns
	var_Column = var_Columns.Add("C1")
		' var_Column.Def(0) = .t.
		oG2antt.TemplateDef = "dim var_Column"
		oG2antt.TemplateDef = var_Column
		oG2antt.Template = "var_Column.Def(0) = True"

		var_Column.Width = 24
		var_Column.AllowSizing = .f.
		' var_Column.Def(48) = 3
		oG2antt.TemplateDef = "dim var_Column"
		oG2antt.TemplateDef = var_Column
		oG2antt.Template = "var_Column.Def(48) = 3"

	var_Column1 = var_Columns.Add("C2")
		' var_Column1.Def(0) = .t.
		oG2antt.TemplateDef = "dim var_Column1"
		oG2antt.TemplateDef = var_Column1
		oG2antt.Template = "var_Column1.Def(0) = True"

		' var_Column1.Def(48) = 2
		oG2antt.TemplateDef = "dim var_Column1"
		oG2antt.TemplateDef = var_Column1
		oG2antt.Template = "var_Column1.Def(48) = 2"

	var_Columns.Add("Column1")
var_Chart = oG2antt.Chart
	var_Chart.BackColorLevelHeader = oG2antt.BackColorHeader
	var_Chart.LevelCount = 2
	var_Chart.DrawGridLines = -1
	var_Chart.FirstVisibleDate = {06/22/2014}
	' var_Chart.PaneWidth(.f.) = 256
	oG2antt.TemplateDef = "dim var_Chart"
	oG2antt.TemplateDef = var_Chart
	oG2antt.Template = "var_Chart.PaneWidth(False) = 256"

var_Items = oG2antt.Items
	h = var_Items.AddItem("")
	' var_Items.CellValue(h,1) = "Cell 1.2"
	oG2antt.TemplateDef = "dim var_Items,h"
	oG2antt.TemplateDef = var_Items
	oG2antt.TemplateDef = h
	oG2antt.Template = "var_Items.CellValue(h,1) = `Cell 1.2`"

	' var_Items.CellValue(h,2) = "Cell 1.3"
	oG2antt.TemplateDef = "dim var_Items,h"
	oG2antt.TemplateDef = var_Items
	oG2antt.TemplateDef = h
	oG2antt.Template = "var_Items.CellValue(h,2) = `Cell 1.3`"

	var_Items.AddBar(h,"Task",{06/23/2014},{06/25/2014})
	h = var_Items.AddItem("")
	' var_Items.CellValue(h,1) = "Cell 2.2"
	oG2antt.TemplateDef = "dim var_Items,h"
	oG2antt.TemplateDef = var_Items
	oG2antt.TemplateDef = h
	oG2antt.Template = "var_Items.CellValue(h,1) = `Cell 2.2`"

	' var_Items.CellValue(h,2) = "Cell 2.3"
	oG2antt.TemplateDef = "dim var_Items,h"
	oG2antt.TemplateDef = var_Items
	oG2antt.TemplateDef = h
	oG2antt.Template = "var_Items.CellValue(h,2) = `Cell 2.3`"

	var_Items.AddBar(h,"Task",{06/26/2014},{06/28/2014})
oG2antt.EndUpdate()
|
|
1884
|
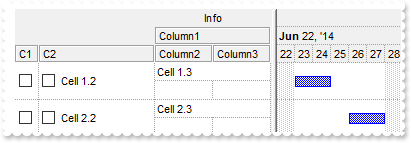
How do I change the color of the columns's header to cover all levels (sample CRD)
Dim h as N
Dim oG2antt as P
Dim var_Chart as P
Dim var_Column as P
Dim var_Column1 as P
Dim var_Column2 as local
Dim var_Column3 as local
Dim var_Column4 as local
Dim var_Column5 as P
Dim var_Columns as P
Dim var_Items as P

oG2antt = topparent:CONTROL_ACTIVEX1.activex
oG2antt.BeginUpdate()
oG2antt.DrawGridLines = -1
oG2antt.BackColorLevelHeader = oG2antt.BackColorHeader
oG2antt.HeaderAppearance = 4
oG2antt.DefaultItemHeight = 36
oG2antt.TreeColumnIndex = -1
var_Columns = oG2antt.Columns
	var_Column = var_Columns.Add("C1")
		' var_Column.Def(0) = .t.
		oG2antt.TemplateDef = "dim var_Column"
		oG2antt.TemplateDef = var_Column
		oG2antt.Template = "var_Column.Def(0) = True"

		var_Column.Width = 24
		var_Column.AllowSizing = .f.
		' var_Column.Def(48) = 3
		oG2antt.TemplateDef = "dim var_Column"
		oG2antt.TemplateDef = var_Column
		oG2antt.Template = "var_Column.Def(48) = 3"

	var_Column1 = var_Columns.Add("C2")
		' var_Column1.Def(0) = .t.
		oG2antt.TemplateDef = "dim var_Column1"
		oG2antt.TemplateDef = var_Column1
		oG2antt.Template = "var_Column1.Def(0) = True"

		' var_Column1.Def(48) = 2
		oG2antt.TemplateDef = "dim var_Column1"
		oG2antt.TemplateDef = var_Column1
		oG2antt.Template = "var_Column1.Def(48) = 2"

	' var_Columns.Add("Column1").Visible = .f.
	var_Column2 = var_Columns.Add("Column1")
	oG2antt.TemplateDef = "dim var_Column2"
	oG2antt.TemplateDef = var_Column2
	oG2antt.Template = "var_Column2.Visible = False"

	' var_Columns.Add("Column2").Visible = .f.
	var_Column3 = var_Columns.Add("Column2")
	oG2antt.TemplateDef = "dim var_Column3"
	oG2antt.TemplateDef = var_Column3
	oG2antt.Template = "var_Column3.Visible = False"

	' var_Columns.Add("Column3").Visible = .f.
	var_Column4 = var_Columns.Add("Column3")
	oG2antt.TemplateDef = "dim var_Column4"
	oG2antt.TemplateDef = var_Column4
	oG2antt.Template = "var_Column4.Visible = False"

	var_Column5 = var_Columns.Add("FormatLevel")
		var_Column5.FormatLevel = "18;\"Info\"[a=17]/(2/3,4)"
		' var_Column5.Def(32) = "2/3,4"
		oG2antt.TemplateDef = "dim var_Column5"
		oG2antt.TemplateDef = var_Column5
		oG2antt.Template = "var_Column5.Def(32) = `2/3,4`"

var_Chart = oG2antt.Chart
	var_Chart.DrawGridLines = -1
	var_Chart.FirstVisibleDate = {06/22/2014}
	' var_Chart.PaneWidth(.f.) = 256
	oG2antt.TemplateDef = "dim var_Chart"
	oG2antt.TemplateDef = var_Chart
	oG2antt.Template = "var_Chart.PaneWidth(False) = 256"

	var_Chart.BackColorLevelHeader = oG2antt.BackColorHeader
var_Items = oG2antt.Items
	h = var_Items.AddItem("")
	' var_Items.CellValue(h,1) = "Cell 1.2"
	oG2antt.TemplateDef = "dim var_Items,h"
	oG2antt.TemplateDef = var_Items
	oG2antt.TemplateDef = h
	oG2antt.Template = "var_Items.CellValue(h,1) = `Cell 1.2`"

	' var_Items.CellValue(h,2) = "Cell 1.3"
	oG2antt.TemplateDef = "dim var_Items,h"
	oG2antt.TemplateDef = var_Items
	oG2antt.TemplateDef = h
	oG2antt.Template = "var_Items.CellValue(h,2) = `Cell 1.3`"

	var_Items.AddBar(h,"Task",{06/23/2014},{06/25/2014})
	h = var_Items.AddItem("")
	' var_Items.CellValue(h,1) = "Cell 2.2"
	oG2antt.TemplateDef = "dim var_Items,h"
	oG2antt.TemplateDef = var_Items
	oG2antt.TemplateDef = h
	oG2antt.Template = "var_Items.CellValue(h,1) = `Cell 2.2`"

	' var_Items.CellValue(h,2) = "Cell 2.3"
	oG2antt.TemplateDef = "dim var_Items,h"
	oG2antt.TemplateDef = var_Items
	oG2antt.TemplateDef = h
	oG2antt.Template = "var_Items.CellValue(h,2) = `Cell 2.3`"

	var_Items.AddBar(h,"Task",{06/26/2014},{06/28/2014})
oG2antt.EndUpdate()
|
|
1883
|
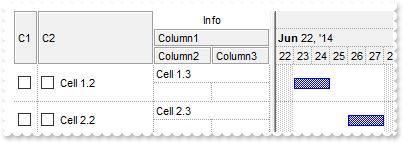
Is it possible to extend the columns's header to fill all levels (sample CRD)
Dim h as N
Dim oG2antt as P
Dim var_Chart as P
Dim var_Column as P
Dim var_Column1 as P
Dim var_Column2 as local
Dim var_Column3 as local
Dim var_Column4 as local
Dim var_Column5 as P
Dim var_Columns as P
Dim var_Items as P

oG2antt = topparent:CONTROL_ACTIVEX1.activex
oG2antt.BeginUpdate()
oG2antt.DrawGridLines = -1
oG2antt.HeaderVisible = 1
oG2antt.HeaderAppearance = 4
oG2antt.DefaultItemHeight = 36
oG2antt.TreeColumnIndex = -1
var_Columns = oG2antt.Columns
	var_Column = var_Columns.Add("C1")
		' var_Column.Def(0) = .t.
		oG2antt.TemplateDef = "dim var_Column"
		oG2antt.TemplateDef = var_Column
		oG2antt.Template = "var_Column.Def(0) = True"

		var_Column.Width = 24
		var_Column.AllowSizing = .f.
		' var_Column.Def(48) = 3
		oG2antt.TemplateDef = "dim var_Column"
		oG2antt.TemplateDef = var_Column
		oG2antt.Template = "var_Column.Def(48) = 3"

	var_Column1 = var_Columns.Add("C2")
		' var_Column1.Def(0) = .t.
		oG2antt.TemplateDef = "dim var_Column1"
		oG2antt.TemplateDef = var_Column1
		oG2antt.Template = "var_Column1.Def(0) = True"

		' var_Column1.Def(48) = 2
		oG2antt.TemplateDef = "dim var_Column1"
		oG2antt.TemplateDef = var_Column1
		oG2antt.Template = "var_Column1.Def(48) = 2"

	' var_Columns.Add("Column1").Visible = .f.
	var_Column2 = var_Columns.Add("Column1")
	oG2antt.TemplateDef = "dim var_Column2"
	oG2antt.TemplateDef = var_Column2
	oG2antt.Template = "var_Column2.Visible = False"

	' var_Columns.Add("Column2").Visible = .f.
	var_Column3 = var_Columns.Add("Column2")
	oG2antt.TemplateDef = "dim var_Column3"
	oG2antt.TemplateDef = var_Column3
	oG2antt.Template = "var_Column3.Visible = False"

	' var_Columns.Add("Column3").Visible = .f.
	var_Column4 = var_Columns.Add("Column3")
	oG2antt.TemplateDef = "dim var_Column4"
	oG2antt.TemplateDef = var_Column4
	oG2antt.Template = "var_Column4.Visible = False"

	var_Column5 = var_Columns.Add("FormatLevel")
		var_Column5.FormatLevel = "18;\"Info\"[a=17]/(2/3,4)"
		' var_Column5.Def(32) = "2/3,4"
		oG2antt.TemplateDef = "dim var_Column5"
		oG2antt.TemplateDef = var_Column5
		oG2antt.Template = "var_Column5.Def(32) = `2/3,4`"

var_Chart = oG2antt.Chart
	var_Chart.DrawGridLines = -1
	var_Chart.FirstVisibleDate = {06/22/2014}
	' var_Chart.PaneWidth(.f.) = 256
	oG2antt.TemplateDef = "dim var_Chart"
	oG2antt.TemplateDef = var_Chart
	oG2antt.Template = "var_Chart.PaneWidth(False) = 256"

	var_Chart.BackColorLevelHeader = oG2antt.BackColorHeader
var_Items = oG2antt.Items
	h = var_Items.AddItem("")
	' var_Items.CellValue(h,1) = "Cell 1.2"
	oG2antt.TemplateDef = "dim var_Items,h"
	oG2antt.TemplateDef = var_Items
	oG2antt.TemplateDef = h
	oG2antt.Template = "var_Items.CellValue(h,1) = `Cell 1.2`"

	' var_Items.CellValue(h,2) = "Cell 1.3"
	oG2antt.TemplateDef = "dim var_Items,h"
	oG2antt.TemplateDef = var_Items
	oG2antt.TemplateDef = h
	oG2antt.Template = "var_Items.CellValue(h,2) = `Cell 1.3`"

	var_Items.AddBar(h,"Task",{06/23/2014},{06/25/2014})
	h = var_Items.AddItem("")
	' var_Items.CellValue(h,1) = "Cell 2.2"
	oG2antt.TemplateDef = "dim var_Items,h"
	oG2antt.TemplateDef = var_Items
	oG2antt.TemplateDef = h
	oG2antt.Template = "var_Items.CellValue(h,1) = `Cell 2.2`"

	' var_Items.CellValue(h,2) = "Cell 2.3"
	oG2antt.TemplateDef = "dim var_Items,h"
	oG2antt.TemplateDef = var_Items
	oG2antt.TemplateDef = h
	oG2antt.Template = "var_Items.CellValue(h,2) = `Cell 2.3`"

	var_Items.AddBar(h,"Task",{06/26/2014},{06/28/2014})
oG2antt.EndUpdate()
|
|
1882
|
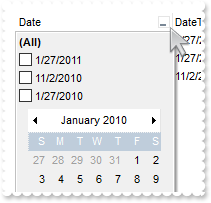
How do I get sorted the column as string, numeric, date, date and time. Also how can it be applied to drop down filter panel
Dim h as N
Dim oG2antt as P
Dim var_Chart as local
Dim var_Column as P
Dim var_Column1 as P
Dim var_Column2 as P
Dim var_Column3 as P
Dim var_Column4 as P
Dim var_Items as P

oG2antt = topparent:CONTROL_ACTIVEX1.activex
oG2antt.BeginUpdate()
' oG2antt.Chart.PaneWidth(.t.) = 0
var_Chart = oG2antt.Chart
oG2antt.TemplateDef = "dim var_Chart"
oG2antt.TemplateDef = var_Chart
oG2antt.Template = "var_Chart.PaneWidth(True) = 0"

var_Column = oG2antt.Columns.Add("Date")
	var_Column.SortType = 2
	var_Column.DisplayFilterButton = .t.
	var_Column.DisplayFilterPattern = .f.
	var_Column.DisplayFilterDate = .t.
	var_Column.FilterList = 1296 'exShowFocusItem + exShowCheckBox + exSortItemsDesc
var_Column1 = oG2antt.Columns.Add("DateTime")
	var_Column1.SortType = 3
	var_Column1.DisplayFilterButton = .t.
	var_Column1.DisplayFilterPattern = .f.
	var_Column1.FilterList = 1296 'exShowFocusItem + exShowCheckBox + exSortItemsDesc
var_Column2 = oG2antt.Columns.Add("Time")
	var_Column2.SortType = 4
	var_Column2.DisplayFilterButton = .t.
	var_Column2.DisplayFilterPattern = .f.
	var_Column2.FilterList = 1296 'exShowFocusItem + exShowCheckBox + exSortItemsDesc
	var_Column2.FormatColumn = "time(value)"
var_Column3 = oG2antt.Columns.Add("Numeric")
	var_Column3.SortType = 1
	var_Column3.DisplayFilterButton = .t.
	var_Column3.FilterList = 1296 'exShowFocusItem + exShowCheckBox + exSortItemsDesc
var_Column4 = oG2antt.Columns.Add("String")
	var_Column4.DisplayFilterButton = .t.
	var_Column4.FilterList = 1296 'exShowFocusItem + exShowCheckBox + exSortItemsDesc
var_Items = oG2antt.Items
	h = var_Items.AddItem({01/27/2010})
	' var_Items.CellValue(h,1) = {01/27/2010 10:00:00}
	oG2antt.TemplateDef = "dim var_Items,h"
	oG2antt.TemplateDef = var_Items
	oG2antt.TemplateDef = h
	oG2antt.Template = "var_Items.CellValue(h,1) = #1/27/2010 10:00:00 AM#"

	' var_Items.CellValue(h,2) = var_Items.CellValue(h,1)
	oG2antt.TemplateDef = "dim var_Items,h"
	oG2antt.TemplateDef = var_Items
	oG2antt.TemplateDef = h
	oG2antt.Template = "var_Items.CellValue(h,2) = CellValue(h,1)"

	' var_Items.CellValue(h,3) = 1
	oG2antt.TemplateDef = "dim var_Items,h"
	oG2antt.TemplateDef = var_Items
	oG2antt.TemplateDef = h
	oG2antt.Template = "var_Items.CellValue(h,3) = 1"

	' var_Items.CellValue(h,4) = var_Items.CellValue(h,3)
	oG2antt.TemplateDef = "dim var_Items,h"
	oG2antt.TemplateDef = var_Items
	oG2antt.TemplateDef = h
	oG2antt.Template = "var_Items.CellValue(h,4) = CellValue(h,3)"

	h = var_Items.AddItem({01/27/2011})
	' var_Items.CellValue(h,1) = {01/27/2011 09:00:00}
	oG2antt.TemplateDef = "dim var_Items,h"
	oG2antt.TemplateDef = var_Items
	oG2antt.TemplateDef = h
	oG2antt.Template = "var_Items.CellValue(h,1) = #1/27/2011 9:00:00 AM#"

	' var_Items.CellValue(h,2) = var_Items.CellValue(h,1)
	oG2antt.TemplateDef = "dim var_Items,h"
	oG2antt.TemplateDef = var_Items
	oG2antt.TemplateDef = h
	oG2antt.Template = "var_Items.CellValue(h,2) = CellValue(h,1)"

	' var_Items.CellValue(h,3) = 11
	oG2antt.TemplateDef = "dim var_Items,h"
	oG2antt.TemplateDef = var_Items
	oG2antt.TemplateDef = h
	oG2antt.Template = "var_Items.CellValue(h,3) = 11"

	' var_Items.CellValue(h,4) = var_Items.CellValue(h,3)
	oG2antt.TemplateDef = "dim var_Items,h"
	oG2antt.TemplateDef = var_Items
	oG2antt.TemplateDef = h
	oG2antt.Template = "var_Items.CellValue(h,4) = CellValue(h,3)"

	h = var_Items.AddItem({11/02/2010})
	' var_Items.CellValue(h,1) = {11/02/2010 09:00:00}
	oG2antt.TemplateDef = "dim var_Items,h"
	oG2antt.TemplateDef = var_Items
	oG2antt.TemplateDef = h
	oG2antt.Template = "var_Items.CellValue(h,1) = #11/2/2010 9:00:00 AM#"

	' var_Items.CellValue(h,2) = var_Items.CellValue(h,1)
	oG2antt.TemplateDef = "dim var_Items,h"
	oG2antt.TemplateDef = var_Items
	oG2antt.TemplateDef = h
	oG2antt.Template = "var_Items.CellValue(h,2) = CellValue(h,1)"

	' var_Items.CellValue(h,3) = 2
	oG2antt.TemplateDef = "dim var_Items,h"
	oG2antt.TemplateDef = var_Items
	oG2antt.TemplateDef = h
	oG2antt.Template = "var_Items.CellValue(h,3) = 2"

	' var_Items.CellValue(h,4) = var_Items.CellValue(h,3)
	oG2antt.TemplateDef = "dim var_Items,h"
	oG2antt.TemplateDef = var_Items
	oG2antt.TemplateDef = h
	oG2antt.Template = "var_Items.CellValue(h,4) = CellValue(h,3)"

oG2antt.Columns.Item("DateTime").DisplayFilterDate = .f.
oG2antt.EndUpdate()
|
|
1881
|
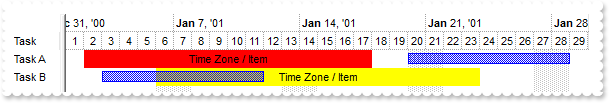
Is there a way to set the time zone per item
Dim h1 as N
Dim oG2antt as P
Dim var_Chart as P
Dim var_Items as P

oG2antt = topparent:CONTROL_ACTIVEX1.activex
oG2antt.BeginUpdate()
oG2antt.Columns.Add("Task")
oG2antt.BackColorLevelHeader = oG2antt.BackColor
var_Chart = oG2antt.Chart
	var_Chart.LevelCount = 2
	var_Chart.FirstVisibleDate = {01/01/2001}
	' var_Chart.PaneWidth(.f.) = 48
	oG2antt.TemplateDef = "dim var_Chart"
	oG2antt.TemplateDef = var_Chart
	oG2antt.Template = "var_Chart.PaneWidth(False) = 48"

var_Items = oG2antt.Items
	h1 = var_Items.AddItem("Task A")
	var_Items.AddBar(h1,"",{01/02/2001},{01/18/2001},"TZ1","Time Zone / Item")
	' var_Items.ItemBar(h1,"TZ1",29) = .f.
	oG2antt.TemplateDef = "dim var_Items,h1"
	oG2antt.TemplateDef = var_Items
	oG2antt.TemplateDef = h1
	oG2antt.Template = "var_Items.ItemBar(h1,`TZ1`,29) = False"

	' var_Items.ItemBar(h1,"TZ1",7) = 255
	oG2antt.TemplateDef = "dim var_Items,h1"
	oG2antt.TemplateDef = var_Items
	oG2antt.TemplateDef = h1
	oG2antt.Template = "var_Items.ItemBar(h1,`TZ1`,7) = 255"

	var_Items.AddBar(h1,"Task",{01/20/2001},{01/29/2001},"Z1")
	h1 = var_Items.AddItem("Task B")
	var_Items.AddBar(h1,"",{01/06/2001},{01/24/2001},"TZ2","Time Zone / Item")
	' var_Items.ItemBar(h1,"TZ2",29) = .f.
	oG2antt.TemplateDef = "dim var_Items,h1"
	oG2antt.TemplateDef = var_Items
	oG2antt.TemplateDef = h1
	oG2antt.Template = "var_Items.ItemBar(h1,`TZ2`,29) = False"

	' var_Items.ItemBar(h1,"TZ2",7) = 65535
	oG2antt.TemplateDef = "dim var_Items,h1"
	oG2antt.TemplateDef = var_Items
	oG2antt.TemplateDef = h1
	oG2antt.Template = "var_Items.ItemBar(h1,`TZ2`,7) = 65535"

	var_Items.AddBar(h1,"Task",{01/03/2001},{01/12/2001},"Z1")
oG2antt.EndUpdate()
|
|
1880
|
Is there a way to turn arrow-key-navigation between the items on and off
' Occurs when the user presses a key while an object has the focus.
function KeyDown as v (KeyCode  as  N, Shift  as  N)
	oG2antt = topparent:CONTROL_ACTIVEX1.activex
	KeyCode = 0
end function

Dim h1 as N
Dim oG2antt as P
Dim var_Bar as P
Dim var_Chart as P
Dim var_Column as P
Dim var_Items as P

oG2antt = topparent:CONTROL_ACTIVEX1.activex
oG2antt.BeginUpdate()
oG2antt.Columns.Add("Tasks")
var_Column = oG2antt.Columns.Add("Effort")
	' var_Column.Def(18) = 21
	oG2antt.TemplateDef = "dim var_Column"
	oG2antt.TemplateDef = var_Column
	oG2antt.Template = "var_Column.Def(18) = 21"

	var_Column.Editor.EditType = 4
var_Chart = oG2antt.Chart
	var_Chart.LevelCount = 2
	var_Chart.NonworkingDays = 0
	' var_Chart.PaneWidth(.f.) = 96
	oG2antt.TemplateDef = "dim var_Chart"
	oG2antt.TemplateDef = var_Chart
	oG2antt.Template = "var_Chart.PaneWidth(False) = 96"

	var_Chart.FirstVisibleDate = {06/20/2005}
	var_Chart.HistogramVisible = .t.
	var_Chart.HistogramHeight = 128
	var_Chart.HistogramView = 112
	var_Bar = var_Chart.Bars.Item("Task")
		var_Bar.HistogramPattern = var_Bar.Pattern
		var_Bar.HistogramType = 0
		var_Bar.HistogramCriticalValue = 3
		var_Bar.ShowHistogramValues = "value>3?255:1"
		var_Bar.HistogramItems = -11
		var_Bar.HistogramGridLinesColor = 12632256
		var_Bar.HistogramRulerLinesColor = 65536
		var_Bar.FormatHistogramValues = "value format `2`"
var_Items = oG2antt.Items
	var_Items.AllowCellValueToItemBar = .t.
	h1 = var_Items.AddItem("Task 1")
	var_Items.AddBar(h1,"Task",{06/21/2005},{06/23/2005})
	' var_Items.CellValue(h1,1) = 6.79
	oG2antt.TemplateDef = "dim var_Items,h1"
	oG2antt.TemplateDef = var_Items
	oG2antt.TemplateDef = h1
	oG2antt.Template = "var_Items.CellValue(h1,1) = 6.79"

	h1 = var_Items.AddItem("Task 2")
	var_Items.AddBar(h1,"Task",{06/24/2005},{06/26/2005})
	' var_Items.CellValue(h1,1) = 3.19
	oG2antt.TemplateDef = "dim var_Items,h1"
	oG2antt.TemplateDef = var_Items
	oG2antt.TemplateDef = h1
	oG2antt.Template = "var_Items.CellValue(h1,1) = 3.19"

	h1 = var_Items.AddItem("Task 3")
	var_Items.AddBar(h1,"Task",{06/27/2005},{06/29/2005})
	' var_Items.CellValue(h1,1) = 2
	oG2antt.TemplateDef = "dim var_Items,h1"
	oG2antt.TemplateDef = var_Items
	oG2antt.TemplateDef = h1
	oG2antt.Template = "var_Items.CellValue(h1,1) = 2"

	h1 = var_Items.AddItem("Task 4")
	var_Items.AddBar(h1,"Task",{06/30/2005},{07/02/2005})
	' var_Items.CellValue(h1,1) = 1
	oG2antt.TemplateDef = "dim var_Items,h1"
	oG2antt.TemplateDef = var_Items
	oG2antt.TemplateDef = h1
	oG2antt.Template = "var_Items.CellValue(h1,1) = 1"

oG2antt.EndUpdate()
|
|
1879
|
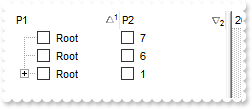
I am using Layout property to sort multiple columns at once. The problem is that all items get expanded. How do I prevent that
Dim h as N
Dim oG2antt as P
Dim var_Column as P
Dim var_Column1 as P
Dim var_Items as P

oG2antt = topparent:CONTROL_ACTIVEX1.activex
oG2antt.BeginUpdate()
oG2antt.LinesAtRoot = -1
var_Column = oG2antt.Columns.Add("P1")
	' var_Column.Def(0) = .t.
	oG2antt.TemplateDef = "dim var_Column"
	oG2antt.TemplateDef = var_Column
	oG2antt.Template = "var_Column.Def(0) = True"

	var_Column.PartialCheck = .t.
var_Column1 = oG2antt.Columns.Add("P2")
	' var_Column1.Def(0) = .t.
	oG2antt.TemplateDef = "dim var_Column1"
	oG2antt.TemplateDef = var_Column1
	oG2antt.Template = "var_Column1.Def(0) = True"

	var_Column1.PartialCheck = .t.
	var_Column1.FormatColumn = "1 index ``"
var_Items = oG2antt.Items
	h = var_Items.AddItem("Root")
	var_Items.InsertItem(h,,"Child A")
	var_Items.InsertItem(h,,"Child B")
	var_Items.InsertItem(h,,"Child A")
	var_Items.InsertItem(h,,"Child B")
	var_Items.AddItem("Root")
	var_Items.AddItem("Root")
oG2antt.SingleSort = .f.
oG2antt.Layout = "multiplesort=\"C0:1 C1:2\";collapse=\"\""
oG2antt.EndUpdate()
|
|
1878
|
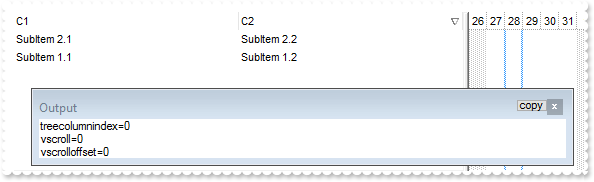
How can I decode the Layout property
Dim oG2antt as P
Dim var_Column as local
Dim var_Columns as P
Dim var_Items as P
Dim var_Print as P

oG2antt = topparent:CONTROL_ACTIVEX1.activex
oG2antt.BeginUpdate()
var_Columns = oG2antt.Columns
	var_Columns.Add("C1")
	' var_Columns.Add("C2").Position = 1
	var_Column = var_Columns.Add("C2")
	oG2antt.TemplateDef = "dim var_Column"
	oG2antt.TemplateDef = var_Column
	oG2antt.Template = "var_Column.Position = 1"

var_Items = oG2antt.Items
	' var_Items.CellValue(var_Items.AddItem("SubItem 1.1"),1) = "SubItem 1.2"
	oG2antt.TemplateDef = "dim var_Items"
	oG2antt.TemplateDef = var_Items
	oG2antt.Template = "var_Items.CellValue(AddItem(`SubItem 1.1`),1) = `SubItem 1.2`"

	' var_Items.CellValue(var_Items.AddItem("SubItem 2.1"),1) = "SubItem 2.2"
	oG2antt.TemplateDef = "dim var_Items"
	oG2antt.TemplateDef = var_Items
	oG2antt.Template = "var_Items.CellValue(AddItem(`SubItem 2.1`),1) = `SubItem 2.2`"

oG2antt.Columns.Item("C2").SortOrder = 2
oG2antt.EndUpdate()
? "Encoded:"
? oG2antt.Layout
var_Print = OLE.Create("Exontrol.Print")
	? "Decoded: "
	? var_Print.Decode64TextW(oG2antt.Layout)
|
|
1877
|
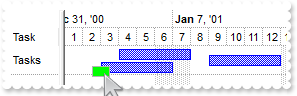
Is it possible to define a bar inside a bar (method 2)
Dim h as N
Dim oG2antt as P
Dim var_Chart as P
Dim var_Items as P
Dim var_Note as P
Dim var_Notes as P

oG2antt = topparent:CONTROL_ACTIVEX1.activex
oG2antt.BeginUpdate()
oG2antt.ScrollBySingleLine = .t.
oG2antt.Columns.Add("Task")
oG2antt.DrawGridLines = 1
oG2antt.BackColorLevelHeader = oG2antt.BackColor
var_Chart = oG2antt.Chart
	var_Chart.LevelCount = 2
	var_Chart.DrawGridLines = 1
	var_Chart.AllowCreateBar = 1
	var_Chart.AllowLinkBars = .f.
	var_Chart.ResizeUnitScale = 65536
	' var_Chart.PaneWidth(.f.) = 48
	oG2antt.TemplateDef = "dim var_Chart"
	oG2antt.TemplateDef = var_Chart
	oG2antt.Template = "var_Chart.PaneWidth(False) = 48"

	var_Chart.FirstVisibleDate = {01/01/2001}
	var_Chart.Bars.Item("Task").OverlaidType = 515 'exOverlaidBarsStackAutoArrange + exOverlaidBarsStack
var_Items = oG2antt.Items
	h = var_Items.AddItem("Tasks")
	var_Items.AddBar(h,"Task",{01/03/2001},{01/07/2001},"A1")
	var_Items.AddBar(h,"Task",{01/04/2001},{01/08/2001},"A2")
	var_Items.AddBar(h,"Task",{01/09/2001},{01/13/2001},"A3")
var_Notes = oG2antt.Chart.Notes
	var_Note = var_Notes.Add("N1",oG2antt.Items.FirstVisibleItem,"A1","")
		' var_Note.PartText(0) = " "
		oG2antt.TemplateDef = "dim var_Note"
		oG2antt.TemplateDef = var_Note
		oG2antt.Template = "var_Note.PartText(0) = ` `"

		' var_Note.PartFixedWidth(0) = 18
		oG2antt.TemplateDef = "dim var_Note"
		oG2antt.TemplateDef = var_Note
		oG2antt.Template = "var_Note.PartFixedWidth(0) = 18"

		' var_Note.PartFixedHeight(0) = 11
		oG2antt.TemplateDef = "dim var_Note"
		oG2antt.TemplateDef = var_Note
		oG2antt.Template = "var_Note.PartFixedHeight(0) = 11"

		' var_Note.PartCanMove(0) = .t.
		oG2antt.TemplateDef = "dim var_Note"
		oG2antt.TemplateDef = var_Note
		oG2antt.Template = "var_Note.PartCanMove(0) = True"

		' var_Note.PartBackColor(0) = 65280
		oG2antt.TemplateDef = "dim var_Note"
		oG2antt.TemplateDef = var_Note
		oG2antt.Template = "var_Note.PartBackColor(0) = 65280"

		' var_Note.PartVisible(1) = .f.
		oG2antt.TemplateDef = "dim var_Note"
		oG2antt.TemplateDef = var_Note
		oG2antt.Template = "var_Note.PartVisible(1) = False"

		var_Note.ShowLink = 0
		' var_Note.PartVOffset(0) = 4
		oG2antt.TemplateDef = "dim var_Note"
		oG2antt.TemplateDef = var_Note
		oG2antt.Template = "var_Note.PartVOffset(0) = 4"

oG2antt.EndUpdate()
|
|
1876
|
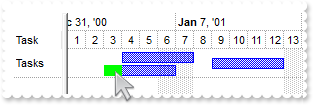
Is it possible to define a bar inside a bar (method 1)
Dim h as N
Dim oG2antt as P
Dim var_Bar as P
Dim var_Bar1 as P
Dim var_Bar2 as P
Dim var_Chart as P
Dim var_Items as P

oG2antt = topparent:CONTROL_ACTIVEX1.activex
oG2antt.BeginUpdate()
oG2antt.ScrollBySingleLine = .t.
oG2antt.Columns.Add("Task")
oG2antt.DrawGridLines = 1
oG2antt.BackColorLevelHeader = oG2antt.BackColor
var_Chart = oG2antt.Chart
	var_Chart.LevelCount = 2
	var_Chart.DrawGridLines = 1
	var_Chart.AllowCreateBar = 1
	var_Chart.AllowLinkBars = .f.
	var_Chart.ResizeUnitScale = 65536
	' var_Chart.PaneWidth(.f.) = 48
	oG2antt.TemplateDef = "dim var_Chart"
	oG2antt.TemplateDef = var_Chart
	oG2antt.Template = "var_Chart.PaneWidth(False) = 48"

	var_Chart.FirstVisibleDate = {01/01/2001}
	var_Bar = var_Chart.Bars.Item("Task")
		var_Bar.OverlaidType = 515 'exOverlaidBarsStackAutoArrange + exOverlaidBarsStack
		var_Bar.OverlaidGroup = "Task,TaskB"
	var_Bar1 = var_Chart.Bars.Add("Aka")
		var_Bar1.Color = 65280
		var_Bar1.Pattern = 1
	var_Bar2 = var_Chart.Bars.Add("Task%Aka")
		var_Bar2.Shortcut = "TaskB"
		var_Bar2.OverlaidType = 515 'exOverlaidBarsStackAutoArrange + exOverlaidBarsStack
		var_Bar2.OverlaidGroup = "Task,TaskB"
var_Items = oG2antt.Items
	h = var_Items.AddItem("Tasks")
	var_Items.AddBar(h,"TaskB",{01/03/2001},{01/07/2001},"A1")
	' var_Items.ItemBar(h,"A1",12) = 0.25
	oG2antt.TemplateDef = "dim var_Items,h"
	oG2antt.TemplateDef = var_Items
	oG2antt.TemplateDef = h
	oG2antt.Template = "var_Items.ItemBar(h,`A1`,12) = 0.25"

	var_Items.AddBar(h,"Task",{01/04/2001},{01/08/2001},"A2")
	var_Items.AddBar(h,"Task",{01/09/2001},{01/13/2001},"A3")
oG2antt.EndUpdate()
|
|
1875
|
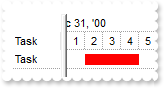
How do I show the bar with a solid color, no border (method 1)
Dim h as N
Dim oG2antt as P
Dim var_Bar as P
Dim var_Chart as P
Dim var_Items as P

oG2antt = topparent:CONTROL_ACTIVEX1.activex
oG2antt.BeginUpdate()
oG2antt.ScrollBySingleLine = .t.
oG2antt.Columns.Add("Task")
oG2antt.DrawGridLines = 1
oG2antt.BackColorLevelHeader = oG2antt.BackColor
var_Chart = oG2antt.Chart
	var_Chart.LevelCount = 2
	var_Chart.DrawGridLines = 1
	var_Chart.AllowCreateBar = 1
	var_Chart.AllowLinkBars = .f.
	var_Chart.ResizeUnitScale = 65536
	' var_Chart.PaneWidth(.f.) = 48
	oG2antt.TemplateDef = "dim var_Chart"
	oG2antt.TemplateDef = var_Chart
	oG2antt.Template = "var_Chart.PaneWidth(False) = 48"

	var_Chart.FirstVisibleDate = {01/01/2001}
	var_Bar = var_Chart.Bars.Item("Task")
		var_Bar.Color = 255
		var_Bar.Pattern = 1
var_Items = oG2antt.Items
	h = var_Items.AddItem("Task")
	var_Items.AddBar(h,"Task",{01/02/2001},{01/05/2001},"")
oG2antt.EndUpdate()
|
|
1874
|
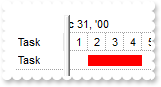
How do I show the bar with a solid color, no border (method 2)
Dim h as N
Dim oG2antt as P
Dim var_Bar as P
Dim var_Chart as P
Dim var_Items as P

oG2antt = topparent:CONTROL_ACTIVEX1.activex
oG2antt.BeginUpdate()
oG2antt.ScrollBySingleLine = .t.
oG2antt.Columns.Add("Task")
oG2antt.DrawGridLines = 1
oG2antt.BackColorLevelHeader = oG2antt.BackColor
var_Chart = oG2antt.Chart
	var_Chart.LevelCount = 2
	var_Chart.DrawGridLines = 1
	var_Chart.AllowCreateBar = 1
	var_Chart.AllowLinkBars = .f.
	var_Chart.ResizeUnitScale = 65536
	' var_Chart.PaneWidth(.f.) = 48
	oG2antt.TemplateDef = "dim var_Chart"
	oG2antt.TemplateDef = var_Chart
	oG2antt.Template = "var_Chart.PaneWidth(False) = 48"

	var_Chart.FirstVisibleDate = {01/01/2001}
	var_Bar = var_Chart.Bars.Item("Task")
		var_Bar.Color = 255
		var_Bar.StartColor = var_Bar.Color
		var_Bar.EndColor = var_Bar.Color
		var_Bar.Pattern = 32
var_Items = oG2antt.Items
	h = var_Items.AddItem("Task")
	var_Items.AddBar(h,"Task",{01/02/2001},{01/05/2001},"")
oG2antt.EndUpdate()
|
|
1873
|
How do I show the bar with a solid color, no border (method 3)
Dim h as N
Dim oG2antt as P
Dim var_Appearance as P
Dim var_Bar as P
Dim var_Chart as P
Dim var_Items as P

oG2antt = topparent:CONTROL_ACTIVEX1.activex
oG2antt.BeginUpdate()
oG2antt.ScrollBySingleLine = .t.
oG2antt.Columns.Add("Task")
oG2antt.DrawGridLines = 1
oG2antt.BackColorLevelHeader = oG2antt.BackColor
var_Chart = oG2antt.Chart
	var_Chart.LevelCount = 2
	var_Chart.DrawGridLines = 1
	var_Chart.AllowCreateBar = 1
	var_Chart.AllowLinkBars = .f.
	var_Chart.ResizeUnitScale = 65536
	' var_Chart.PaneWidth(.f.) = 48
	oG2antt.TemplateDef = "dim var_Chart"
	oG2antt.TemplateDef = var_Chart
	oG2antt.Template = "var_Chart.PaneWidth(False) = 48"

	var_Chart.FirstVisibleDate = {01/01/2001}
var_Appearance = oG2antt.VisualAppearance
	var_Appearance.RenderType = -1
	var_Appearance.Add(1,"gBFLBCJwBAEHhEJAAEhABJkIQAAYAQGKQYhiAKBQAGaAoDDcMA4QwAAyDQKkEwsACEIrjKCRShyCYZRhGcTSBCIZBqEqSZLiEZRQiiCYsS5AcgPfKgAAFESNY5gSL5Yj2IjrRDCMAggI")
var_Bar = oG2antt.Chart.Bars.Item("Task")
	var_Bar.Color = 16777471
var_Items = oG2antt.Items
	h = var_Items.AddItem("Task")
	var_Items.AddBar(h,"Task",{01/02/2001},{01/05/2001},"")
oG2antt.EndUpdate()
|
|
1872
|
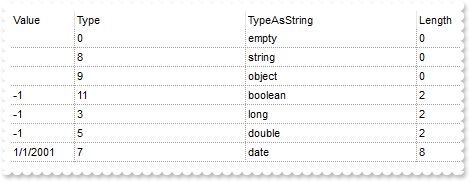
How do I find the cell's type, or what the cell holds
Dim oG2antt as P
Dim var_Chart as local
Dim var_Column as local
Dim var_Column1 as local
Dim var_Column2 as local
Dim var_Column3 as local
Dim var_Columns as P
Dim var_Items as P

oG2antt = topparent:CONTROL_ACTIVEX1.activex
oG2antt.BeginUpdate()
oG2antt.DrawGridLines = -2
' oG2antt.Chart.PaneWidth(.t.) = 0
var_Chart = oG2antt.Chart
oG2antt.TemplateDef = "dim var_Chart"
oG2antt.TemplateDef = var_Chart
oG2antt.Template = "var_Chart.PaneWidth(True) = 0"

var_Columns = oG2antt.Columns
	' var_Columns.Add("Value").Width = 24
	var_Column = var_Columns.Add("Value")
	oG2antt.TemplateDef = "dim var_Column"
	oG2antt.TemplateDef = var_Column
	oG2antt.Template = "var_Column.Width = 24"

	' var_Columns.Add("Type").FormatColumn = "type(%0)"
	var_Column1 = var_Columns.Add("Type")
	oG2antt.TemplateDef = "dim var_Column1"
	oG2antt.TemplateDef = var_Column1
	oG2antt.Template = "var_Column1.FormatColumn = `type(%0)`"

	' var_Columns.Add("TypeAsString").FormatColumn = "(0 := type(%0)) array (`empty`, `null`, `short`, `long`, `float`, `double`, `currency`, `date`, `string`, `object`, `error`, `boolean`, `variant`, `any`, `reserved`, `decimal`, `char`, `byte`, `unsigned short`, `unsigned long`, `long on 64 bits`)"
	var_Column2 = var_Columns.Add("TypeAsString")
	oG2antt.TemplateDef = "dim var_Column2"
	oG2antt.TemplateDef = var_Column2
	oG2antt.Template = "var_Column2.FormatColumn = `(0 := type(%0)) array (``empty``, ``null``, ``short``, ``long``, ``float``, ``double``, ``currency``, ``date``, ``string``, ``object``, ``error``, ``boolean``, ``variant``, ``any``, ``reserved``, ``decimal``, ``char``, ``byte``, ``unsigned short``, ``unsigned long``, ``long on 64 bits``)`"

	' var_Columns.Add("Length").FormatColumn = "len(%0)"
	var_Column3 = var_Columns.Add("Length")
	oG2antt.TemplateDef = "dim var_Column3"
	oG2antt.TemplateDef = var_Column3
	oG2antt.Template = "var_Column3.FormatColumn = `len(%0)`"

var_Items = oG2antt.Items
	var_Items.AddItem()
	var_Items.AddItem("")
	' var_Items.CellValue(.AddItem(),0) = oG2antt
	oG2antt.TemplateDef = "dim var_Items"
	oG2antt.TemplateDef = var_Items
	oG2antt.Template = "var_Items.CellValue(AddItem(),0) = Me"

	' var_Items.CellValue(var_Items.AddItem(),0) = .t.
	oG2antt.TemplateDef = "dim var_Items"
	oG2antt.TemplateDef = var_Items
	oG2antt.Template = "var_Items.CellValue(AddItem(),0) = True"

	' var_Items.CellValue(var_Items.AddItem(),0) = -1
	oG2antt.TemplateDef = "dim var_Items"
	oG2antt.TemplateDef = var_Items
	oG2antt.Template = "var_Items.CellValue(AddItem(),0) = -1"

	' var_Items.CellValue(var_Items.AddItem(),0) = -1
	oG2antt.TemplateDef = "dim var_Items"
	oG2antt.TemplateDef = var_Items
	oG2antt.Template = "var_Items.CellValue(AddItem(),0) = -1"

	' var_Items.CellValue(var_Items.AddItem(),0) = {01/01/2001}
	oG2antt.TemplateDef = "dim var_Items"
	oG2antt.TemplateDef = var_Items
	oG2antt.Template = "var_Items.CellValue(AddItem(),0) = #1/1/2001#"

oG2antt.EndUpdate()
|
|
1871
|
Is it possible to allow changing the bar's parent while bar's start/end margins should stay unchanged
' Occurs just before moving a bar from current item to another item.
function BarParentChange as v (Item  as  OLE::Exontrol.G2antt.1::HITEM, Key  as  A, NewItem  as  OLE::Exontrol.G2antt.1::HITEM, Cancel  as  L)
	Dim var_Items as local
	oG2antt = topparent:CONTROL_ACTIVEX1.activex
	' oG2antt.Items.SelectItem(NewItem) = .t.
	var_Items = oG2antt.Items
	oG2antt.TemplateDef = "dim var_Items"
	oG2antt.TemplateDef = var_Items
	oG2antt.Template = "var_Items.SelectItem(NewItem) = True"
	? "BarParentChange from "
	? oG2antt.Items.CellCaption(Item,0)
	? " to "
	? oG2antt.Items.CellCaption(NewItem,0)
end function

Dim h as N
Dim oG2antt as P
Dim var_Bar as P
Dim var_Chart as P
Dim var_Column as local
Dim var_Items as P

oG2antt = topparent:CONTROL_ACTIVEX1.activex
oG2antt.BeginUpdate()
' oG2antt.Columns.Add("Members").Def(17) = 1
var_Column = oG2antt.Columns.Add("Members")
oG2antt.TemplateDef = "dim var_Column"
oG2antt.TemplateDef = var_Column
oG2antt.Template = "var_Column.Def(17) = 1"

oG2antt.SelBackMode = 1
var_Chart = oG2antt.Chart
	var_Chart.SelBackColor = oG2antt.SelBackColor
	var_Chart.FirstVisibleDate = {09/20/2006}
	var_Chart.AllowLinkBars = .f.
	var_Chart.AllowCreateBar = 0
	var_Chart.LevelCount = 2
	' var_Chart.PaneWidth(.f.) = 96
	oG2antt.TemplateDef = "dim var_Chart"
	oG2antt.TemplateDef = var_Chart
	oG2antt.Template = "var_Chart.PaneWidth(False) = 96"

	var_Bar = var_Chart.Bars.Item("Task")
		' var_Bar.Def(4) = 18
		oG2antt.TemplateDef = "dim var_Bar"
		oG2antt.TemplateDef = var_Bar
		oG2antt.Template = "var_Bar.Def(4) = 18"

		' var_Bar.Def(10) = .f.
		oG2antt.TemplateDef = "dim var_Bar"
		oG2antt.TemplateDef = var_Bar
		oG2antt.Template = "var_Bar.Def(10) = False"

var_Items = oG2antt.Items
	var_Items.AddItem("Member <b>1</b>")
	h = var_Items.AddItem("Member <b>2</b>")
	var_Items.AddBar(h,"Task",{09/21/2006},{09/23/2006},"T102","Task <b>102</b>")
	' var_Items.ItemBar(h,"T102",11) = .f.
	oG2antt.TemplateDef = "dim var_Items,h"
	oG2antt.TemplateDef = var_Items
	oG2antt.TemplateDef = h
	oG2antt.Template = "var_Items.ItemBar(h,`T102`,11) = False"

	' var_Items.ItemBar(h,"T102",28) = .t.
	oG2antt.TemplateDef = "dim var_Items,h"
	oG2antt.TemplateDef = var_Items
	oG2antt.TemplateDef = h
	oG2antt.Template = "var_Items.ItemBar(h,`T102`,28) = True"

	var_Items.AddItem("Member <b>3</b>")
	var_Items.AddItem("Member <b>4</b>")
oG2antt.EndUpdate()
|
|
1870
|
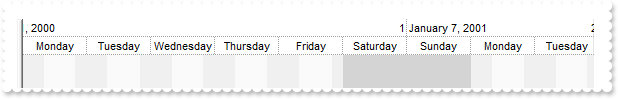
Is it possible to (un)highlight the day/night shifts
' Occurs when the user presses and then releases the left mouse button over the tree control.
function Click as v ()
	Dim var_Chart as P
	oG2antt = topparent:CONTROL_ACTIVEX1.activex
	var_Chart = oG2antt.Chart
		var_Chart.ShowNonworkingDates = .f.
		var_Chart.ShowNonworkingHours = .f.
		var_Chart.BackColor = 16777215
	oG2antt.Refresh()
end function

Dim oG2antt as P
Dim var_Chart as P

oG2antt = topparent:CONTROL_ACTIVEX1.activex
oG2antt.BeginUpdate()
var_Chart = oG2antt.Chart
	var_Chart.FirstVisibleDate = {01/01/2001}
	var_Chart.LevelCount = 2
	var_Chart.UnitScale = 4096
	var_Chart.UnitWidth = 64
	' var_Chart.PaneWidth(.f.) = 0
	oG2antt.TemplateDef = "dim var_Chart"
	oG2antt.TemplateDef = var_Chart
	oG2antt.Template = "var_Chart.PaneWidth(False) = 0"

	var_Chart.NonworkingHours = 15728895
	var_Chart.NonworkingHoursPattern = 1
	var_Chart.NonworkingDaysPattern = var_Chart.NonworkingHoursPattern
	var_Chart.NonworkingHoursColor = 15790320
	var_Chart.NonworkingDaysColor = 13948116
	var_Chart.BackColor = 16448250
oG2antt.EndUpdate()
|
|
1869
|
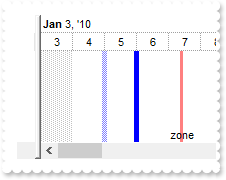
How can I add a vertical line at specified date-time
Dim oG2antt as P
Dim var_Chart as P

oG2antt = topparent:CONTROL_ACTIVEX1.activex
var_Chart = oG2antt.Chart
	' var_Chart.PaneWidth(.f.) = 18
	oG2antt.TemplateDef = "dim var_Chart"
	oG2antt.TemplateDef = var_Chart
	oG2antt.Template = "var_Chart.PaneWidth(False) = 18"

	var_Chart.LevelCount = 2
	var_Chart.UnitWidth = 32
	var_Chart.FirstVisibleDate = {01/01/2010}
	var_Chart.MarkTimeZone("M1",{01/05/2010},{01/05/2010},16711680,"50:5;3")
	var_Chart.MarkTimeZone("M2",{01/06/2010},{01/06/2010},16711680,":5")
	var_Chart.MarkTimeZone("M3",{01/07/2010 10:00:00},{01/07/2010 10:00:00},255,"50:3;;zone")
|
|
1868
|
How do I clear all date-time zones
' Occurs when the user presses and then releases the left mouse button over the tree control.
function Click as v ()
	oG2antt = topparent:CONTROL_ACTIVEX1.activex
	oG2antt.Chart.RemoveTimeZone("<*>")
end function

' Fired when right mouse button is clicked
function RClick as v ()
	oG2antt = topparent:CONTROL_ACTIVEX1.activex
	oG2antt.Chart.RemoveTimeZone("<Z*>")
end function

Dim oG2antt as P
Dim var_Chart as P

oG2antt = topparent:CONTROL_ACTIVEX1.activex
var_Chart = oG2antt.Chart
	' var_Chart.PaneWidth(.f.) = 18
	oG2antt.TemplateDef = "dim var_Chart"
	oG2antt.TemplateDef = var_Chart
	oG2antt.Template = "var_Chart.PaneWidth(False) = 18"

	var_Chart.LevelCount = 2
	var_Chart.FirstVisibleDate = {01/01/2010}
	var_Chart.MarkTimeZone("Z1",{01/04/2010},{01/05/2010},255)
	var_Chart.MarkTimeZone("Z2",{01/11/2010},{01/12/2010},65280)
	var_Chart.MarkTimeZone("M1",{01/07/2010},{01/08/2010},16711680,"50:5;3")
|
|
1867
|
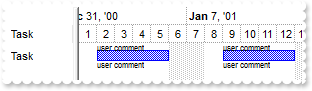
How do I place a comment above/bellow the bar (sample 4)
Dim h as N
Dim oG2antt as P
Dim var_Bar as P
Dim var_Chart as P
Dim var_Items as P

oG2antt = topparent:CONTROL_ACTIVEX1.activex
oG2antt.BeginUpdate()
oG2antt.DefaultItemHeight = 26
oG2antt.Columns.Add("Task")
var_Chart = oG2antt.Chart
	var_Chart.LevelCount = 2
	var_Chart.FirstVisibleDate = {01/01/2001}
	' var_Chart.PaneWidth(.f.) = 64
	oG2antt.TemplateDef = "dim var_Chart"
	oG2antt.TemplateDef = var_Chart
	oG2antt.Template = "var_Chart.PaneWidth(False) = 64"

	var_Bar = var_Chart.Bars.Item("Task")
		' var_Bar.Def(5) = 18
		oG2antt.TemplateDef = "dim var_Bar"
		oG2antt.TemplateDef = var_Bar
		oG2antt.Template = "var_Bar.Def(5) = 18"

		' var_Bar.Def(4) = 0
		oG2antt.TemplateDef = "dim var_Bar"
		oG2antt.TemplateDef = var_Bar
		oG2antt.Template = "var_Bar.Def(4) = 0"

		' var_Bar.Def(44) = " "
		oG2antt.TemplateDef = "dim var_Bar"
		oG2antt.TemplateDef = var_Bar
		oG2antt.Template = "var_Bar.Def(44) = ` `"

		' var_Bar.Def(45) = 0
		oG2antt.TemplateDef = "dim var_Bar"
		oG2antt.TemplateDef = var_Bar
		oG2antt.Template = "var_Bar.Def(45) = 0"

		' var_Bar.Def(46) = 16
		oG2antt.TemplateDef = "dim var_Bar"
		oG2antt.TemplateDef = var_Bar
		oG2antt.Template = "var_Bar.Def(46) = 16"

var_Items = oG2antt.Items
	h = var_Items.AddItem("Task")
	var_Items.AddBar(h,"Task",{01/02/2001},{01/06/2001},"K1","<font ;6>user comment")
	' var_Items.ItemBar(h,"K1",44) = "<font ;6>user comment"
	oG2antt.TemplateDef = "dim var_Items,h"
	oG2antt.TemplateDef = var_Items
	oG2antt.TemplateDef = h
	oG2antt.Template = "var_Items.ItemBar(h,`K1`,44) = `<font ;6>user comment`"

	var_Items.AddBar(h,"Task",{01/09/2001},{01/13/2001},"K2","<font ;6>user comment")
	' var_Items.ItemBar(h,"K2",44) = "<font ;6>user comment"
	oG2antt.TemplateDef = "dim var_Items,h"
	oG2antt.TemplateDef = var_Items
	oG2antt.TemplateDef = h
	oG2antt.Template = "var_Items.ItemBar(h,`K2`,44) = `<font ;6>user comment`"

oG2antt.EndUpdate()
|
|
1866
|
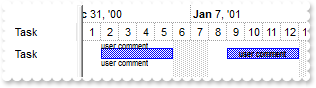
How do I place a comment above/bellow the bar (sample 3)
Dim h as N
Dim oG2antt as P
Dim var_Chart as P
Dim var_Items as P

oG2antt = topparent:CONTROL_ACTIVEX1.activex
oG2antt.BeginUpdate()
oG2antt.DefaultItemHeight = 26
oG2antt.Columns.Add("Task")
var_Chart = oG2antt.Chart
	var_Chart.LevelCount = 2
	var_Chart.FirstVisibleDate = {01/01/2001}
	' var_Chart.PaneWidth(.f.) = 64
	oG2antt.TemplateDef = "dim var_Chart"
	oG2antt.TemplateDef = var_Chart
	oG2antt.Template = "var_Chart.PaneWidth(False) = 64"

var_Items = oG2antt.Items
	h = var_Items.AddItem("Task")
	var_Items.AddBar(h,"Task",{01/02/2001},{01/06/2001},"K1","<font ;6>user comment")
	' var_Items.ItemBar(h,"K1",5) = 18
	oG2antt.TemplateDef = "dim var_Items,h"
	oG2antt.TemplateDef = var_Items
	oG2antt.TemplateDef = h
	oG2antt.Template = "var_Items.ItemBar(h,`K1`,5) = 18"

	' var_Items.ItemBar(h,"K1",4) = 0
	oG2antt.TemplateDef = "dim var_Items,h"
	oG2antt.TemplateDef = var_Items
	oG2antt.TemplateDef = h
	oG2antt.Template = "var_Items.ItemBar(h,`K1`,4) = 0"

	' var_Items.ItemBar(h,"K1",44) = "<font ;6>user comment"
	oG2antt.TemplateDef = "dim var_Items,h"
	oG2antt.TemplateDef = var_Items
	oG2antt.TemplateDef = h
	oG2antt.Template = "var_Items.ItemBar(h,`K1`,44) = `<font ;6>user comment`"

	' var_Items.ItemBar(h,"K1",45) = 0
	oG2antt.TemplateDef = "dim var_Items,h"
	oG2antt.TemplateDef = var_Items
	oG2antt.TemplateDef = h
	oG2antt.Template = "var_Items.ItemBar(h,`K1`,45) = 0"

	' var_Items.ItemBar(h,"K1",46) = 16
	oG2antt.TemplateDef = "dim var_Items,h"
	oG2antt.TemplateDef = var_Items
	oG2antt.TemplateDef = h
	oG2antt.Template = "var_Items.ItemBar(h,`K1`,46) = 16"

	var_Items.AddBar(h,"Task",{01/09/2001},{01/13/2001},"K2","<font ;6>user comment")
	' var_Items.ItemBar(h,"K2",44) = "<font ;6>user comment"
	oG2antt.TemplateDef = "dim var_Items,h"
	oG2antt.TemplateDef = var_Items
	oG2antt.TemplateDef = h
	oG2antt.Template = "var_Items.ItemBar(h,`K2`,44) = `<font ;6>user comment`"

oG2antt.EndUpdate()
|
|
1865
|
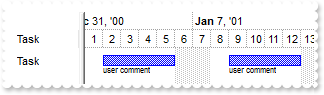
How do I place a comment under the bar (sample 2)
Dim h as N
Dim oG2antt as P
Dim var_Bar as P
Dim var_Chart as P
Dim var_Items as P

oG2antt = topparent:CONTROL_ACTIVEX1.activex
oG2antt.BeginUpdate()
oG2antt.DefaultItemHeight = 26
oG2antt.Columns.Add("Task")
var_Chart = oG2antt.Chart
	var_Chart.LevelCount = 2
	var_Chart.FirstVisibleDate = {01/01/2001}
	' var_Chart.PaneWidth(.f.) = 64
	oG2antt.TemplateDef = "dim var_Chart"
	oG2antt.TemplateDef = var_Chart
	oG2antt.Template = "var_Chart.PaneWidth(False) = 64"

	var_Bar = var_Chart.Bars.Item("Task")
		' var_Bar.Def(5) = 18
		oG2antt.TemplateDef = "dim var_Bar"
		oG2antt.TemplateDef = var_Bar
		oG2antt.Template = "var_Bar.Def(5) = 18"

		' var_Bar.Def(4) = 0
		oG2antt.TemplateDef = "dim var_Bar"
		oG2antt.TemplateDef = var_Bar
		oG2antt.Template = "var_Bar.Def(4) = 0"

var_Items = oG2antt.Items
	h = var_Items.AddItem("Task")
	var_Items.AddBar(h,"Task",{01/02/2001},{01/06/2001},"K1","<font ;6>user comment")
	var_Items.AddBar(h,"Task",{01/09/2001},{01/13/2001},"K2","<font ;6>user comment")
oG2antt.EndUpdate()
|
|
1864
|
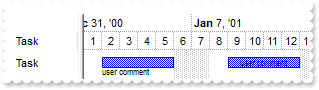
How do I place a comment under the bar (sample 1)
Dim h as N
Dim oG2antt as P
Dim var_Chart as P
Dim var_Items as P

oG2antt = topparent:CONTROL_ACTIVEX1.activex
oG2antt.BeginUpdate()
oG2antt.DefaultItemHeight = 26
oG2antt.Columns.Add("Task")
var_Chart = oG2antt.Chart
	var_Chart.LevelCount = 2
	var_Chart.FirstVisibleDate = {01/01/2001}
	' var_Chart.PaneWidth(.f.) = 64
	oG2antt.TemplateDef = "dim var_Chart"
	oG2antt.TemplateDef = var_Chart
	oG2antt.Template = "var_Chart.PaneWidth(False) = 64"

var_Items = oG2antt.Items
	h = var_Items.AddItem("Task")
	var_Items.AddBar(h,"Task",{01/02/2001},{01/06/2001},"K1","<font ;6>user comment")
	' var_Items.ItemBar(h,"K1",5) = 18
	oG2antt.TemplateDef = "dim var_Items,h"
	oG2antt.TemplateDef = var_Items
	oG2antt.TemplateDef = h
	oG2antt.Template = "var_Items.ItemBar(h,`K1`,5) = 18"

	' var_Items.ItemBar(h,"K1",4) = 0
	oG2antt.TemplateDef = "dim var_Items,h"
	oG2antt.TemplateDef = var_Items
	oG2antt.TemplateDef = h
	oG2antt.Template = "var_Items.ItemBar(h,`K1`,4) = 0"

	var_Items.AddBar(h,"Task",{01/09/2001},{01/13/2001},"K2","<font ;6>user comment")
oG2antt.EndUpdate()
|
|
1863
|
I am using exBarCanMoveToAnother to allow a bar to be moved from one item to another. The question is if it is possible somehow to highlight the current bar can be dropped to (sample 2)
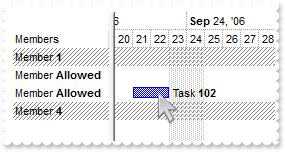
' Occurs just before moving a bar from current item to another item.
function BarParentChange as v (Item  as  OLE::Exontrol.G2antt.1::HITEM, Key  as  A, NewItem  as  OLE::Exontrol.G2antt.1::HITEM, Cancel  as  L)
	Dim var_Items as local
	oG2antt = topparent:CONTROL_ACTIVEX1.activex
	' oG2antt.Items.SelectItem(NewItem) = .t.
	var_Items = oG2antt.Items
	oG2antt.TemplateDef = "dim var_Items"
	oG2antt.TemplateDef = var_Items
	oG2antt.Template = "var_Items.SelectItem(NewItem) = True"
	Cancel = oG2antt.ConditionalFormats.Item("NOTRED").Verify(NewItem)
end function

' Occurs after the chart has been changed.
function ChartEndChanging as v (Operation  as  OLE::Exontrol.G2antt.1::BarOperationEnum)
	oG2antt = topparent:CONTROL_ACTIVEX1.activex
	oG2antt.SelForeColor = -2147483634
	oG2antt.SelBackColor = -2147483635
	oG2antt.Chart.SelBackColor = oG2antt.SelBackColor
	oG2antt.ConditionalFormats.Clear()
end function

' Occurs when the chart is about to be changed.
function ChartStartChanging as v (Operation  as  OLE::Exontrol.G2antt.1::BarOperationEnum)
	Dim var_Chart as P
	Dim var_ConditionalFormat as P
	Dim var_ConditionalFormat1 as P
	oG2antt = topparent:CONTROL_ACTIVEX1.activex
	oG2antt.SelForeColor = oG2antt.ForeColor
	oG2antt.SelBackColor = oG2antt.BackColor
	var_Chart = oG2antt.Chart
		var_Chart.SelBackColor = var_Chart.BackColor
	var_ConditionalFormat = oG2antt.ConditionalFormats.Add("%0 contains `Allowed` ","RED")
		var_ConditionalFormat.Enabled = .f.
	var_ConditionalFormat1 = oG2antt.ConditionalFormats.Add("not ( %0 contains `Allowed` )","NOTRED")
		var_ConditionalFormat1.BackColor = 33488638
		var_ConditionalFormat1.ChartBackColor = var_ConditionalFormat1.BackColor
end function

Dim h as N
Dim oG2antt as P
Dim var_Chart as P
Dim var_Column as local
Dim var_Items as P

oG2antt = topparent:CONTROL_ACTIVEX1.activex
oG2antt.BeginUpdate()
oG2antt.VisualAppearance.Add(1,"gBFLBCJwBAEHhEJAAEhABZkIQAAYAQGKQYhiAKBQAGaAoDDcMA4QwAAyDQKkEwsACEIrjKCRShyCYZRrGUgRCKQahLEiTIhGUYJHgmK4tRoAUbyDBIGQSCCZYDmKA3fj0AI9P7FcgSABEEigNIxToOU4jFgeCR2TqQRK1BDQbQSFCaZrmMKIXICO40WBQFhTdLlRyBBKzLKtCyaBqWaZrWxZE72ZaFVTdOK6bDvGwoarid56X7beA2PgdZTjQi5cCxG5sLrTBZtYzfET3diOEYPQzHMpzDB7bxbGaXZBlGSZbjeGZBUjQc7yfSNMw/HqKZQ6cQwTAIgI")
' oG2antt.Columns.Add("Members").Def(17) = 1
var_Column = oG2antt.Columns.Add("Members")
oG2antt.TemplateDef = "dim var_Column"
oG2antt.TemplateDef = var_Column
oG2antt.Template = "var_Column.Def(17) = 1"

var_Chart = oG2antt.Chart
	var_Chart.SelBackColor = oG2antt.SelBackColor
	var_Chart.FirstVisibleDate = {09/20/2006}
	var_Chart.AllowLinkBars = .f.
	var_Chart.AllowCreateBar = 0
	var_Chart.AllowSelectObjects = 0
	var_Chart.LevelCount = 2
	' var_Chart.PaneWidth(.f.) = 96
	oG2antt.TemplateDef = "dim var_Chart"
	oG2antt.TemplateDef = var_Chart
	oG2antt.Template = "var_Chart.PaneWidth(False) = 96"

	var_Chart.Bars.Item("Task").OverlaidType = 4611 'exOverlaidBarsIncludeCaption + exOverlaidBarsStackAutoArrange + exOverlaidBarsStack
var_Items = oG2antt.Items
	h = var_Items.AddItem("Member <b>1</b>")
	h = var_Items.AddItem("Member <b>Allowed</b>")
	var_Items.AddBar(h,"Task",{09/21/2006},{09/23/2006},"T102","Task <b>102</b>")
	' var_Items.ItemBar(h,"T102",4) = 18
	oG2antt.TemplateDef = "dim var_Items,h"
	oG2antt.TemplateDef = var_Items
	oG2antt.TemplateDef = h
	oG2antt.Template = "var_Items.ItemBar(h,`T102`,4) = 18"

	' var_Items.ItemBar(h,"T102",28) = .t.
	oG2antt.TemplateDef = "dim var_Items,h"
	oG2antt.TemplateDef = var_Items
	oG2antt.TemplateDef = h
	oG2antt.Template = "var_Items.ItemBar(h,`T102`,28) = True"

	h = var_Items.AddItem("Member <b>Allowed</b>")
	h = var_Items.AddItem("Member <b>4</b>")
oG2antt.EndUpdate()
|
|
1862
|
I am using exBarCanMoveToAnother to allow a bar to be moved from one item to another. The question is if it is possible somehow to highlight the current bar can be dropped to (sample 1)
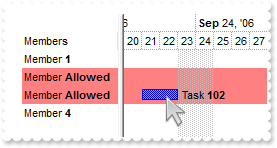
' Occurs just before moving a bar from current item to another item.
function BarParentChange as v (Item  as  OLE::Exontrol.G2antt.1::HITEM, Key  as  A, NewItem  as  OLE::Exontrol.G2antt.1::HITEM, Cancel  as  L)
	Dim var_Items as local
	oG2antt = topparent:CONTROL_ACTIVEX1.activex
	' oG2antt.Items.SelectItem(NewItem) = .t.
	var_Items = oG2antt.Items
	oG2antt.TemplateDef = "dim var_Items"
	oG2antt.TemplateDef = var_Items
	oG2antt.Template = "var_Items.SelectItem(NewItem) = True"
	Cancel = oG2antt.ConditionalFormats.Item("NOTRED").Verify(NewItem)
end function

' Occurs after the chart has been changed.
function ChartEndChanging as v (Operation  as  OLE::Exontrol.G2antt.1::BarOperationEnum)
	oG2antt = topparent:CONTROL_ACTIVEX1.activex
	oG2antt.SelForeColor = -2147483634
	oG2antt.SelBackColor = -2147483635
	oG2antt.Chart.SelBackColor = oG2antt.SelBackColor
	oG2antt.ConditionalFormats.Clear()
end function

' Occurs when the chart is about to be changed.
function ChartStartChanging as v (Operation  as  OLE::Exontrol.G2antt.1::BarOperationEnum)
	Dim var_Chart as P
	Dim var_ConditionalFormat as P
	Dim var_ConditionalFormat1 as P
	oG2antt = topparent:CONTROL_ACTIVEX1.activex
	oG2antt.SelForeColor = oG2antt.ForeColor
	oG2antt.SelBackColor = oG2antt.BackColor
	var_Chart = oG2antt.Chart
		var_Chart.SelBackColor = var_Chart.BackColor
	var_ConditionalFormat = oG2antt.ConditionalFormats.Add("%0 contains `Allowed` ","RED")
		var_ConditionalFormat.BackColor = 8421631
		var_ConditionalFormat.ChartBackColor = var_ConditionalFormat.BackColor
	var_ConditionalFormat1 = oG2antt.ConditionalFormats.Add("not ( %0 contains `Allowed` )","NOTRED")
		var_ConditionalFormat1.Enabled = .f.
end function

Dim h as N
Dim oG2antt as P
Dim var_Chart as P
Dim var_Column as local
Dim var_Items as P

oG2antt = topparent:CONTROL_ACTIVEX1.activex
oG2antt.BeginUpdate()
' oG2antt.Columns.Add("Members").Def(17) = 1
var_Column = oG2antt.Columns.Add("Members")
oG2antt.TemplateDef = "dim var_Column"
oG2antt.TemplateDef = var_Column
oG2antt.Template = "var_Column.Def(17) = 1"

var_Chart = oG2antt.Chart
	var_Chart.SelBackColor = oG2antt.SelBackColor
	var_Chart.FirstVisibleDate = {09/20/2006}
	var_Chart.AllowLinkBars = .f.
	var_Chart.AllowCreateBar = 0
	var_Chart.AllowSelectObjects = 0
	var_Chart.LevelCount = 2
	' var_Chart.PaneWidth(.f.) = 96
	oG2antt.TemplateDef = "dim var_Chart"
	oG2antt.TemplateDef = var_Chart
	oG2antt.Template = "var_Chart.PaneWidth(False) = 96"

	var_Chart.Bars.Item("Task").OverlaidType = 4611 'exOverlaidBarsIncludeCaption + exOverlaidBarsStackAutoArrange + exOverlaidBarsStack
var_Items = oG2antt.Items
	h = var_Items.AddItem("Member <b>1</b>")
	h = var_Items.AddItem("Member <b>Allowed</b>")
	var_Items.AddBar(h,"Task",{09/21/2006},{09/23/2006},"T102","Task <b>102</b>")
	' var_Items.ItemBar(h,"T102",4) = 18
	oG2antt.TemplateDef = "dim var_Items,h"
	oG2antt.TemplateDef = var_Items
	oG2antt.TemplateDef = h
	oG2antt.Template = "var_Items.ItemBar(h,`T102`,4) = 18"

	' var_Items.ItemBar(h,"T102",28) = .t.
	oG2antt.TemplateDef = "dim var_Items,h"
	oG2antt.TemplateDef = var_Items
	oG2antt.TemplateDef = h
	oG2antt.Template = "var_Items.ItemBar(h,`T102`,28) = True"

	h = var_Items.AddItem("Member <b>Allowed</b>")
	h = var_Items.AddItem("Member <b>4</b>")
oG2antt.EndUpdate()
|
|
1861
|
How can I check, if a specified item fits a specified conditional format expression
' Occurs after a new Item has been inserted to Items collection.
function AddItem as v (Item  as  OLE::Exontrol.G2antt.1::HITEM)
	Dim var_Items as P
	oG2antt = topparent:CONTROL_ACTIVEX1.activex
	var_Items = oG2antt.Items
		var_Items.AddBar(Item,"Task",var_Items.CellValue(Item,2),var_Items.CellValue(Item,4))
end function

' Occurs when the user moves the mouse.
function MouseMove as v (Button  as  N, Shift  as  N, X  as  OLE::Exontrol.G2antt.1::OLE_XPOS_PIXELS, Y  as  OLE::Exontrol.G2antt.1::OLE_YPOS_PIXELS)
	Dim h as N
	oG2antt = topparent:CONTROL_ACTIVEX1.activex
	h = oG2antt.ItemFromPoint(-1,-1,c,hit)
	? oG2antt.ConditionalFormats.Item("RED").Verify(h)
end function

Dim oG2antt as P
Dim rs as P
Dim var_Chart as P
Dim var_Columns as local
Dim var_Columns1 as local
Dim var_ConditionalFormat as P
Dim var_ConditionalFormats as P

oG2antt = topparent:CONTROL_ACTIVEX1.activex
oG2antt.BeginUpdate()
var_Chart = oG2antt.Chart
	var_Chart.FirstVisibleDate = {08/03/1994}
	' var_Chart.PaneWidth(.f.) = 256
	oG2antt.TemplateDef = "dim var_Chart"
	oG2antt.TemplateDef = var_Chart
	oG2antt.Template = "var_Chart.PaneWidth(False) = 256"

	var_Chart.LevelCount = 2
	var_Chart.UnitScale = 4096
	var_Chart.FirstWeekDay = 1
oG2antt.Chart.SelBackColor = oG2antt.SelBackColor
oG2antt.SelBackMode = 1
oG2antt.ColumnAutoResize = .f.
oG2antt.ContinueColumnScroll = .f.
rs = OLE.Create("ADOR.Recordset")
	rs.Open("Orders","Provider=Microsoft.ACE.OLEDB.12.0;Data Source=C:\Program Files\Exontrol\ExG2antt\Sample\Access\misc.accdb",3,3)
oG2antt.DataSource = rs
oG2antt.Items.AllowCellValueToItemBar = .t.
' oG2antt.Columns.Item(2).Def(18) = 1
var_Columns = oG2antt.Columns.Item(2)
oG2antt.TemplateDef = "dim var_Columns"
oG2antt.TemplateDef = var_Columns
oG2antt.Template = "var_Columns.Def(18) = 1"

' oG2antt.Columns.Item(4).Def(18) = 2
var_Columns1 = oG2antt.Columns.Item(4)
oG2antt.TemplateDef = "dim var_Columns1"
oG2antt.TemplateDef = var_Columns1
oG2antt.Template = "var_Columns1.Def(18) = 2"

var_ConditionalFormats = oG2antt.ConditionalFormats
	var_ConditionalFormat = var_ConditionalFormats.Add("%1 = 5","RED")
		var_ConditionalFormat.BackColor = 8421631
		var_ConditionalFormat.ChartBackColor = var_ConditionalFormat.BackColor
oG2antt.EndUpdate()
|
|
1860
|
Is it possible to apply the conditional format on the items shown on the chart part of the control (sample 3)
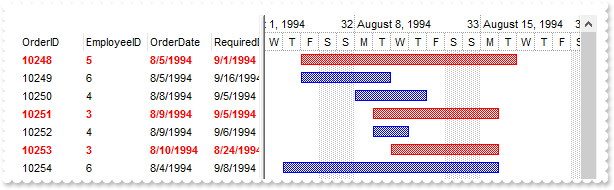
' Occurs after a new Item has been inserted to Items collection.
function AddItem as v (Item  as  OLE::Exontrol.G2antt.1::HITEM)
	Dim var_Items as P
	oG2antt = topparent:CONTROL_ACTIVEX1.activex
	var_Items = oG2antt.Items
		var_Items.AddBar(Item,"Task",var_Items.CellValue(Item,2),var_Items.CellValue(Item,4))
end function

Dim oG2antt as P
Dim rs as P
Dim var_Chart as P
Dim var_Columns as local
Dim var_Columns1 as local
Dim var_ConditionalFormat as P
Dim var_ConditionalFormats as P

oG2antt = topparent:CONTROL_ACTIVEX1.activex
oG2antt.BeginUpdate()
oG2antt.SelBackMode = 1
var_Chart = oG2antt.Chart
	var_Chart.SelBackColor = oG2antt.SelBackColor
	var_Chart.FirstVisibleDate = {08/03/1994}
	' var_Chart.PaneWidth(.f.) = 256
	oG2antt.TemplateDef = "dim var_Chart"
	oG2antt.TemplateDef = var_Chart
	oG2antt.Template = "var_Chart.PaneWidth(False) = 256"

	var_Chart.LevelCount = 2
	var_Chart.UnitScale = 4096
	var_Chart.FirstWeekDay = 1
oG2antt.ColumnAutoResize = .f.
oG2antt.ContinueColumnScroll = .f.
rs = OLE.Create("ADOR.Recordset")
	rs.Open("Orders","Provider=Microsoft.ACE.OLEDB.12.0;Data Source=C:\Program Files\Exontrol\ExG2antt\Sample\Access\misc.accdb",3,3)
oG2antt.DataSource = rs
oG2antt.Items.AllowCellValueToItemBar = .t.
' oG2antt.Columns.Item(2).Def(18) = 1
var_Columns = oG2antt.Columns.Item(2)
oG2antt.TemplateDef = "dim var_Columns"
oG2antt.TemplateDef = var_Columns
oG2antt.Template = "var_Columns.Def(18) = 1"

' oG2antt.Columns.Item(4).Def(18) = 2
var_Columns1 = oG2antt.Columns.Item(4)
oG2antt.TemplateDef = "dim var_Columns1"
oG2antt.TemplateDef = var_Columns1
oG2antt.Template = "var_Columns1.Def(18) = 2"

var_ConditionalFormats = oG2antt.ConditionalFormats
	var_ConditionalFormat = var_ConditionalFormats.Add("%1 in (3,5)")
		var_ConditionalFormat.ApplyToBars = "Task"
		var_ConditionalFormat.BarColor = 255
		var_ConditionalFormat.BarOverviewColor = 255
		var_ConditionalFormat.ForeColor = var_ConditionalFormat.BarColor
		var_ConditionalFormat.Bold = .t.
oG2antt.EndUpdate()
|
|
1859
|
Is it possible to apply the conditional format on the items shown on the chart part of the control (sample 2)
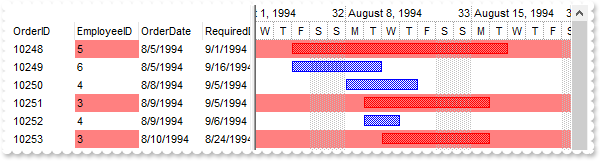
' Occurs after a new Item has been inserted to Items collection.
function AddItem as v (Item  as  OLE::Exontrol.G2antt.1::HITEM)
	Dim var_Items as P
	oG2antt = topparent:CONTROL_ACTIVEX1.activex
	var_Items = oG2antt.Items
		var_Items.AddBar(Item,"Task",var_Items.CellValue(Item,2),var_Items.CellValue(Item,4))
end function

Dim oG2antt as P
Dim rs as P
Dim var_Chart as P
Dim var_Columns as local
Dim var_Columns1 as local
Dim var_ConditionalFormat as P
Dim var_ConditionalFormat1 as P
Dim var_ConditionalFormats as P

oG2antt = topparent:CONTROL_ACTIVEX1.activex
oG2antt.BeginUpdate()
oG2antt.SelBackMode = 1
var_Chart = oG2antt.Chart
	var_Chart.SelBackColor = oG2antt.SelBackColor
	var_Chart.FirstVisibleDate = {08/03/1994}
	' var_Chart.PaneWidth(.f.) = 256
	oG2antt.TemplateDef = "dim var_Chart"
	oG2antt.TemplateDef = var_Chart
	oG2antt.Template = "var_Chart.PaneWidth(False) = 256"

	var_Chart.LevelCount = 2
	var_Chart.UnitScale = 4096
	var_Chart.FirstWeekDay = 1
oG2antt.ColumnAutoResize = .f.
oG2antt.ContinueColumnScroll = .f.
rs = OLE.Create("ADOR.Recordset")
	rs.Open("Orders","Provider=Microsoft.ACE.OLEDB.12.0;Data Source=C:\Program Files\Exontrol\ExG2antt\Sample\Access\misc.accdb",3,3)
oG2antt.DataSource = rs
oG2antt.Items.AllowCellValueToItemBar = .t.
' oG2antt.Columns.Item(2).Def(18) = 1
var_Columns = oG2antt.Columns.Item(2)
oG2antt.TemplateDef = "dim var_Columns"
oG2antt.TemplateDef = var_Columns
oG2antt.Template = "var_Columns.Def(18) = 1"

' oG2antt.Columns.Item(4).Def(18) = 2
var_Columns1 = oG2antt.Columns.Item(4)
oG2antt.TemplateDef = "dim var_Columns1"
oG2antt.TemplateDef = var_Columns1
oG2antt.Template = "var_Columns1.Def(18) = 2"

var_ConditionalFormats = oG2antt.ConditionalFormats
	var_ConditionalFormat = var_ConditionalFormats.Add("%1 in (3,5)")
		var_ConditionalFormat.ApplyTo = 1 '1 +
		var_ConditionalFormat.BackColor = 8421631
	var_ConditionalFormat1 = var_ConditionalFormats.Add("%1 in (3,5)")
		var_ConditionalFormat1.ApplyToBars = "Task"
		var_ConditionalFormat1.BarColor = 255
		var_ConditionalFormat1.BarOverviewColor = 255
		var_ConditionalFormat1.ChartBackColor = 8421631
oG2antt.EndUpdate()
|
|
1858
|
Is it possible to apply the conditional format on the items shown on the chart part of the control (sample 1)
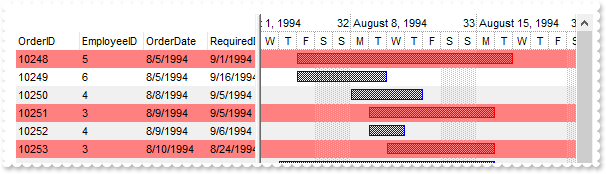
' Occurs after a new Item has been inserted to Items collection.
function AddItem as v (Item  as  OLE::Exontrol.G2antt.1::HITEM)
	Dim var_Items as P
	oG2antt = topparent:CONTROL_ACTIVEX1.activex
	var_Items = oG2antt.Items
		var_Items.AddBar(Item,"Task",var_Items.CellValue(Item,2),var_Items.CellValue(Item,4))
end function

Dim oG2antt as P
Dim rs as P
Dim var_Chart as P
Dim var_Columns as local
Dim var_Columns1 as local
Dim var_ConditionalFormat as P
Dim var_ConditionalFormats as P

oG2antt = topparent:CONTROL_ACTIVEX1.activex
oG2antt.BeginUpdate()
var_Chart = oG2antt.Chart
	var_Chart.FirstVisibleDate = {08/03/1994}
	' var_Chart.PaneWidth(.f.) = 256
	oG2antt.TemplateDef = "dim var_Chart"
	oG2antt.TemplateDef = var_Chart
	oG2antt.Template = "var_Chart.PaneWidth(False) = 256"

	var_Chart.LevelCount = 2
	var_Chart.UnitScale = 4096
	var_Chart.FirstWeekDay = 1
oG2antt.SelBackMode = 1
oG2antt.BackColorAlternate = 15790320
oG2antt.ColumnAutoResize = .f.
oG2antt.ContinueColumnScroll = .f.
rs = OLE.Create("ADOR.Recordset")
	rs.Open("Orders","Provider=Microsoft.ACE.OLEDB.12.0;Data Source=C:\Program Files\Exontrol\ExG2antt\Sample\Access\misc.accdb",3,3)
oG2antt.Chart.SelBackColor = oG2antt.SelBackColor
oG2antt.DataSource = rs
oG2antt.Items.AllowCellValueToItemBar = .t.
' oG2antt.Columns.Item(2).Def(18) = 1
var_Columns = oG2antt.Columns.Item(2)
oG2antt.TemplateDef = "dim var_Columns"
oG2antt.TemplateDef = var_Columns
oG2antt.Template = "var_Columns.Def(18) = 1"

' oG2antt.Columns.Item(4).Def(18) = 2
var_Columns1 = oG2antt.Columns.Item(4)
oG2antt.TemplateDef = "dim var_Columns1"
oG2antt.TemplateDef = var_Columns1
oG2antt.Template = "var_Columns1.Def(18) = 2"

var_ConditionalFormats = oG2antt.ConditionalFormats
	var_ConditionalFormat = var_ConditionalFormats.Add("%1 in (3,5)")
		var_ConditionalFormat.ApplyToBars = "Task"
		var_ConditionalFormat.BarColor = 255
		var_ConditionalFormat.BarOverviewColor = 255
		var_ConditionalFormat.BackColor = 8421631
		var_ConditionalFormat.ChartBackColor = 8421631
oG2antt.EndUpdate()
|
|
1857
|
How can I get ride / hide the image being dragged by OLE Drag and Drop
' Occurs when the OLEDrag method is called.
function OLEStartDrag as v (Data  as  OLE::Exontrol.G2antt.1::IExDataObject, AllowedEffects  as  N)
	' Data.SetData("data to drag")
	oG2antt = topparent:CONTROL_ACTIVEX1.activex
	AllowedEffects = 1
end function

Dim h as N
Dim oG2antt as P
Dim var_Items as P

oG2antt = topparent:CONTROL_ACTIVEX1.activex
oG2antt.OLEDropMode = 1
oG2antt.Template = "Background(34) = 16777215" // oG2antt.Background(34) = 16777215
oG2antt.LinesAtRoot = -1
oG2antt.Columns.Add("Default")
var_Items = oG2antt.Items
	h = var_Items.AddItem("Root")
	var_Items.InsertItem(h,,"Child 1")
	var_Items.InsertItem(h,,"Child 2")
	' var_Items.ExpandItem(h) = .t.
	oG2antt.TemplateDef = "dim var_Items,h"
	oG2antt.TemplateDef = var_Items
	oG2antt.TemplateDef = h
	oG2antt.Template = "var_Items.ExpandItem(h) = True"
|
|
1856
|
How do I change the visual appearance of the split bars
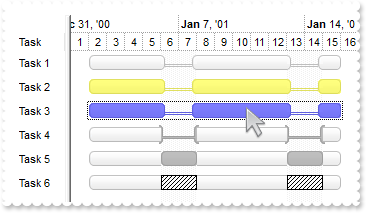
Dim h as N
Dim oG2antt as P
Dim var_Appearance as P
Dim var_Bar as P
Dim var_Bar1 as P
Dim var_Bars as P
Dim var_Chart as P
Dim var_Items as P

oG2antt = topparent:CONTROL_ACTIVEX1.activex
oG2antt.BeginUpdate()
oG2antt.DefaultItemHeight = 24
var_Appearance = oG2antt.VisualAppearance
	var_Appearance.Add(1,"gBFLBCJwBAEHhEJAAEhABEgDg6AADACAxSDEMQBQKAAzQFAYbhgHCGAAGMYhTgmFgAQhFcZQSB0Eg1BKMYwjOJgFgmEQxDQNIBQSLIYQiGSWZBGUBJDjWGgyQjOEByDIMRwjE6UZBgeCRViEMo9RrSEZSLAdGRFAaVYDdULBEACU5VRZQFCwTQcBhpIyoZpkECobh2TYgQjYNT1NSkLxeGoSbbuGhBQrOAw1XTEMhyDR0LTJM6bMBACqrBi2L4xURfOBRXLQAYbHjAZ7rSgacjKRpKRbmAV4Oh+O5pQjadp1TidNwHLoAK7nGwbbgmfwAZrAdjABj1HgBNS2dDkaabQrKEZ4XYAHAXVROOQTWIANb2XC4bwSLAwTJJYzjThiC2GInFOOQckiVw6AeCIvHSBzkCwDxfE6WZ2jsehICadx5kGYZdDgMRrA2c4NmWY56jyGxgEQJIgGkGJHEGVByBkWoCjkNAAAQIQ2AYRoDGQJAoKuZYgBgRZHggHZqAkAZDjYGA7E8KB0kyB5LiiBgigiYhIgiQ4Jk4WIkn6CphjQDgbDmIwDBIMg3GMQ4uDaDZjgiZg6DIY5DGIPg/GQBAMneEJMFkFJqhGTppCYSoSmSSQ2EoPJlAMIhSDmZREAyVYVk0eRkm+FpkmkdhehaTp4iSZQxiYRAODIMQODmJJxhqTwJjYbobmcCZGHKGxLjmVQDC+J4DiYeg8GGWYuH6H5oAoBoCgcTwimaBodmeGZongPRPCoCoOiOZ5qBIIoiAuaZomkPoPGOToEiaaZKHaHYfiUA5OhMAAngoVh6iYKYqHqKoqmGWoGiOKRkHOKJ7D2TxKgaNotmuCpmFAPQrkqPh4iwaw6laOowmwOpwnSL4LmiXJ9D4TxbBqTozm0CxGjwPRtEsIJsjWT4Dlydo1C2Sx2l6N5uAOWpijIDpbhYQ42i4K4mmqOpukuMpnjIJIjmKco5m8S5WnaPZkDuSJ4h0S46FKcY8m+DAHAGPovkoUhgD4cILmsCpCnCTA2nKQgPhwFokh4JpjmsFpEDGDBnBqRpwgwWJ6kSKhZjie5FnGTIXCWR4yAmYh+D+D48g8HpLnMDJHDIPoylObwpWIY5/CyTJzkydw1kSIhzA6ZQ7E+fJrDWUZ0g0JxKksT5NDSPJTmUaRcmAN5Nn0FJ/lMdYNGcWpWnWHRaGAMZ2AQDoEDKNhLicVpViQDYnGqWpPl2HxFDQNwJgoLoGGaCcDInRdjMCuNYbovR2D2FyNgNIcAJC5FWKwNwcBqAzCWBoPgTA8BkEwFwN4HRjjyAMH8EgcQ5CaGIFoAAHQ3AgAAIAQBAQ==")
	var_Appearance.Add(2,"gBFLBCJwBAEHhEJAAEhABBYDg6AADACAxSDEMQBQKAAzQFAYbhgHCGAAGMYhTgmFgAQhFcZQSB0Eg1BKMYwjOJgFgmEQxDQNIBQSLIYQiGSWZTgMYRSASI43RoMUIzVAcQxDEaIZLlGQYHgkNIhDJPcZ0VDUbQGBiQIRmIAHNBwJJUVZFdBDLQkQy5HapZDkECobA+CZQTzUUI1LS9WS1HYaRJle4YRDUMJyQjdV4TRINHQvMinYzqOzrOhaW5TSzLcqyCK0SxxR4AJ4yGobJjiQYJShXcxyDQ8dyZC7PQohG7ofxUAKDVjhMjZRQeMS9JCwaThHElRQHMyBdJkKA9Iq2WaGXBeeQ3JbNbzrYzHb5hHZgAzTOoWbzWFT8BJOFOCAYGcJJjHGTh+C2H40AAL5ckyBQDFkKoWHYLw9iGTpGDUY4zkIdwbF8JhbgMc5hF6OJ8C6BhTkOcBAlsR4NnQaAflAIQJBQBoRgwdAdEcIYVEUQJBGYOBCBMYQUGgNhCEKB5FB4VBBgQXJgF+IAzA4Ig5GIQIQBwOxiGiIgngoYpIi4LoKiMA5KDIMwjEKakmk6OJkkmDpNgidgtgwI55AYJw5iQQwSEYNxkgiZJrEITppDSc4TkyCREmeFJkCkAkLmWAwWFoOolkkNheDuJJJDSb4YmIQ4UkaGZlFkVJVhqTR5jYYw7mWeQ1AkPAnEmVh1C6Z4JiYL4KGQYwQmOH5PBoBh2h0EIaAaBg8GMI5Ij6IpokoNoOiOaJDiaEoiA8KgegGIRpGoZoaiaaZDmCdYlGkZAmgmKJqEqFomimaoKCaIoqGqSo2iwQhknqRoyiyaxKlaNotk8OpCjiLprkqbQJD0LALAaQowmwSwWkaMZQhOVpKjKbJLDaTozm0CxFAkPYtEsVpWjWbYLGaWo2lCGRil6N5pAuBpiDsbhLH6Zo3G4ax6HhYgpFibYjCWa4ml4QhPguVp2D4b4Li6bYPmiSZWngPhvGuWQJj+b5zmsBo+iePAmDCIwoGwGJ6kEL4MA8EJDjCC46FWQwoBObwGkQD4UCcDpDg+PIHBWPpiHwYJxD+MgcH8BpH4cBJ7kicIrnKC4hg+fIjCoPoQhyOwuD8M5CnMPpJCMCIIkOOQOlOfw1k6MnJDwPw0GOfhvDGdQNAIKdalOAJfDedJdC8SxCeyNJQleZhdEoJ4iEyLYWlWVx0GQJJslqTQtjcVJYi6aZ8mMM43EmFwCECJkfYyWiDuAuG0EgdBNB8AYHYMgxwEM1EAIAgIA==")
	var_Appearance.Add(3,"CP:2 -2 -2 2 2")
oG2antt.Columns.Add("Task")
var_Chart = oG2antt.Chart
	var_Chart.LevelCount = 2
	' var_Chart.PaneWidth(.f.) = 48
	oG2antt.TemplateDef = "dim var_Chart"
	oG2antt.TemplateDef = var_Chart
	oG2antt.Template = "var_Chart.PaneWidth(False) = 48"

	var_Chart.FirstVisibleDate = {01/01/2001}
	var_Bars = var_Chart.Bars
		var_Bar = var_Bars.Add("A")
			var_Bar.Height = 15
			var_Bar.Color = 33554432
			var_Bar.Pattern = 6
		var_Bar1 = var_Bars.Add("Task:A")
			var_Bar1.Shortcut = "Task"
			var_Bar1.Height = 15
			var_Bar1.Color = 16777216
			' var_Bar1.Def(20) = .t.
			oG2antt.TemplateDef = "dim var_Bar1"
			oG2antt.TemplateDef = var_Bar1
			oG2antt.Template = "var_Bar1.Def(20) = True"

	var_Chart.NonworkingDaysColor = 15790320
	var_Chart.SelBarColor = 16711680
var_Items = oG2antt.Items
	var_Items.AddBar(var_Items.AddItem("Task 1"),"Task",{01/02/2001},{01/16/2001})
	h = var_Items.AddItem("Task 2")
	var_Items.AddBar(h,"Task",{01/02/2001},{01/16/2001},"")
	' var_Items.ItemBar(h,"",33) = 65535
	oG2antt.TemplateDef = "dim var_Items,h"
	oG2antt.TemplateDef = var_Items
	oG2antt.TemplateDef = h
	oG2antt.Template = "var_Items.ItemBar(h,``,33) = 65535"

	h = var_Items.AddItem("Task 3")
	var_Items.AddBar(h,"Task",{01/02/2001},{01/16/2001},"")
	' var_Items.ItemBar(h,"",257) = .t.
	oG2antt.TemplateDef = "dim var_Items,h"
	oG2antt.TemplateDef = var_Items
	oG2antt.TemplateDef = h
	oG2antt.Template = "var_Items.ItemBar(h,``,257) = True"

	h = var_Items.AddItem("Task 4")
	var_Items.AddBar(h,"Task",{01/02/2001},{01/16/2001},"")
	' var_Items.ItemBar(h,"",40) = 58753152
	oG2antt.TemplateDef = "dim var_Items,h"
	oG2antt.TemplateDef = var_Items
	oG2antt.TemplateDef = h
	oG2antt.Template = "var_Items.ItemBar(h,``,40) = 58753152"

	h = var_Items.AddItem("Task 5")
	var_Items.AddBar(h,"Task",{01/02/2001},{01/16/2001},"")
	' var_Items.ItemBar(h,"",40) = 25198720
	oG2antt.TemplateDef = "dim var_Items,h"
	oG2antt.TemplateDef = var_Items
	oG2antt.TemplateDef = h
	oG2antt.Template = "var_Items.ItemBar(h,``,40) = 25198720"

	h = var_Items.AddItem("Task 6")
	var_Items.AddBar(h,"Task",{01/02/2001},{01/16/2001},"")
	' var_Items.ItemBar(h,"",40) = 2130771712
	oG2antt.TemplateDef = "dim var_Items,h"
	oG2antt.TemplateDef = var_Items
	oG2antt.TemplateDef = h
	oG2antt.Template = "var_Items.ItemBar(h,``,40) = 2130771712"

oG2antt.EndUpdate()
|
|
1855
|
Is there a way to display automatically the duration ( days, hours, minutes ) of the bar next to it
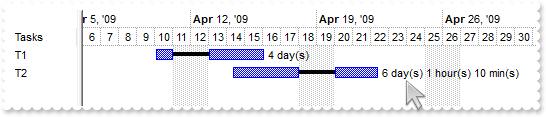
Dim oG2antt as P
Dim var_Bar as P
Dim var_Chart as P
Dim var_Column as P
Dim var_Items as P

oG2antt = topparent:CONTROL_ACTIVEX1.activex
oG2antt.BeginUpdate()
var_Column = oG2antt.Columns.Add("Tasks")
	var_Column.AllowSizing = .f.
	var_Column.Width = 36
oG2antt.BackColorLevelHeader = oG2antt.BackColor
var_Chart = oG2antt.Chart
	' var_Chart.PaneWidth(.f.) = 64
	oG2antt.TemplateDef = "dim var_Chart"
	oG2antt.TemplateDef = var_Chart
	oG2antt.Template = "var_Chart.PaneWidth(False) = 64"

	var_Chart.FirstVisibleDate = {04/06/2009}
	var_Chart.LevelCount = 2
	var_Bar = var_Chart.Bars.Add("Task:Progress")
		var_Bar.Shortcut = "TaskS"
		' var_Bar.Def(3) = "<%=((1:=int(0:= (%258))) != 0 ? (=:1 + ' day(s)') : '') + (=:1 ? ' ' : '' ) + ((1:=int(0:=((=:0 - =:1 + 1/24/60/60/2)*24))) != 0 ? =:1 + ' hour(s)' : '' ) + (=:1 ? ' ' : '' ) + ((1:=round((=:0 - =:1)*60)) != 0 ? =:1 + ' min(s)' : '')%>"
		oG2antt.TemplateDef = "dim var_Bar"
		oG2antt.TemplateDef = var_Bar
		oG2antt.Template = "var_Bar.Def(3) = `<%=((1:=int(0:= (%258))) != 0 ? (=:1 + ' day(s)') : '') + (=:1 ? ' ' : '' ) + ((1:=int(0:=((=:0 - =:1 + 1/24/60/60/2)*24))) != 0 ? =:1 + ' hour(s)' : '' ) + (=:1 ? ' ' : '' ) + ((1:=round((=:0 - =:1)*60)) != 0 ? =:1 + ' min(s)' : '')%>`"

	var_Chart.ResizeUnitScale = 1048576
var_Items = oG2antt.Items
	var_Items.AddBar(var_Items.AddItem("T1"),"TaskS",{04/10/2009 02:30:00},{04/16/2009 02:30:00})
	var_Items.AddBar(var_Items.AddItem("T2"),"TaskS",{04/14/2009 09:00:00},{04/22/2009 10:10:00})
	' var_Items.ItemBar(0,"<*>",20) = .t.
	oG2antt.TemplateDef = "dim var_Items"
	oG2antt.TemplateDef = var_Items
	oG2antt.Template = "var_Items.ItemBar(0,`<*>`,20) = True"

	' var_Items.ItemBar(0,"<*>",4) = 18
	oG2antt.TemplateDef = "dim var_Items"
	oG2antt.TemplateDef = var_Items
	oG2antt.Template = "var_Items.ItemBar(0,`<*>`,4) = 18"

oG2antt.EndUpdate()
|
|
1854
|
Is there a way to display automatically the duration ( days, hours, minutes ) of the bar next to it
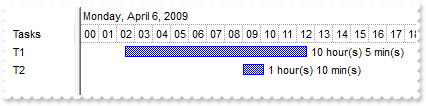
Dim oG2antt as P
Dim var_Bars as local
Dim var_Chart as P
Dim var_Column as P
Dim var_Items as P

oG2antt = topparent:CONTROL_ACTIVEX1.activex
oG2antt.BeginUpdate()
var_Column = oG2antt.Columns.Add("Tasks")
	var_Column.AllowSizing = .f.
	var_Column.Width = 36
oG2antt.BackColorLevelHeader = oG2antt.BackColor
var_Chart = oG2antt.Chart
	' var_Chart.PaneWidth(.f.) = 64
	oG2antt.TemplateDef = "dim var_Chart"
	oG2antt.TemplateDef = var_Chart
	oG2antt.Template = "var_Chart.PaneWidth(False) = 64"

	var_Chart.FirstVisibleDate = {04/06/2009}
	var_Chart.LevelCount = 2
	var_Chart.UnitScale = 65536
	var_Chart.ResizeUnitScale = 1048576
	' var_Chart.Bars.Item("Task").Def(3) = "<%=((1:=int(0:= (%513))) != 0 ? (=:1 + ' day(s)') : '') + (=:1 ? ' ' : '' ) + ((1:=int(0:=((=:0 - =:1 + 1/24/60/60/2)*24))) != 0 ? =:1 + ' hour(s)' : '' ) + (=:1 ? ' ' : '' ) + ((1:=round((=:0 - =:1)*60)) != 0 ? =:1 + ' min(s)' : '')%>"
	var_Bars = var_Chart.Bars.Item("Task")
	oG2antt.TemplateDef = "dim var_Bars"
	oG2antt.TemplateDef = var_Bars
	oG2antt.Template = "var_Bars.Def(3) = `<%=((1:=int(0:= (%513))) != 0 ? (=:1 + ' day(s)') : '') + (=:1 ? ' ' : '' ) + ((1:=int(0:=((=:0 - =:1 + 1/24/60/60/2)*24))) != 0 ? =:1 + ' hour(s)' : '' ) + (=:1 ? ' ' : '' ) + ((1:=round((=:0 - =:1)*60)) != 0 ? =:1 + ' min(s)' : '')%>`"

var_Items = oG2antt.Items
	var_Items.AddBar(var_Items.AddItem("T1"),"Task",{04/06/2009 02:30:00},{04/06/2009 12:35:00})
	var_Items.AddBar(var_Items.AddItem("T2"),"Task",{04/06/2009 09:00:00},{04/06/2009 10:10:00})
	' var_Items.ItemBar(0,"<*>",4) = 18
	oG2antt.TemplateDef = "dim var_Items"
	oG2antt.TemplateDef = var_Items
	oG2antt.Template = "var_Items.ItemBar(0,`<*>`,4) = 18"

oG2antt.EndUpdate()
|
|
1853
|
Does it support single or multiple split pane views
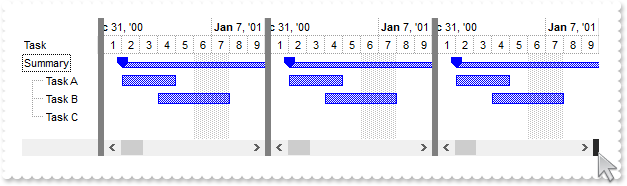
Dim hSummary as N
Dim hTask as N
Dim oG2antt as P
Dim var_Bar as P
Dim var_Chart as P
Dim var_Items as P

oG2antt = topparent:CONTROL_ACTIVEX1.activex
oG2antt.BeginUpdate()
oG2antt.Columns.Add("Task")
oG2antt.Template = "Background(18) = 8421504" // oG2antt.Background(18) = 8421504
oG2antt.Template = "Background(142) = 2631720" // oG2antt.Background(142) = 2631720
var_Chart = oG2antt.Chart
	var_Chart.LevelCount = 2
	' var_Chart.PaneWidth(.f.) = 76
	oG2antt.TemplateDef = "dim var_Chart"
	oG2antt.TemplateDef = var_Chart
	oG2antt.Template = "var_Chart.PaneWidth(False) = 76"

	var_Chart.FirstVisibleDate = {01/01/2001}
	var_Bar = var_Chart.Bars.Item("Summary")
		var_Bar.Pattern = 3
		var_Bar.Shape = 4
		var_Bar.Color = 16711680
		var_Bar.StartColor = var_Bar.Color
		var_Bar.EndColor = var_Bar.Color
	var_Chart.AllowSplitPane = 3 'exAllowTwoSplitPane + exAllowOneSplitPane
	var_Chart.SplitPaneWidth = "128,128"
var_Items = oG2antt.Items
	hSummary = var_Items.AddItem("Summary")
	var_Items.AddBar(hSummary,"Summary",{01/02/2001},{01/02/2001},"")
	hTask = var_Items.InsertItem(hSummary,,"Task A")
	var_Items.AddBar(hTask,"Task",{01/02/2001},{01/05/2001},"K1")
	hTask = var_Items.InsertItem(hSummary,,"Task B")
	var_Items.AddBar(hTask,"Task",{01/04/2001},{01/08/2001},"K2")
	hTask = var_Items.InsertItem(hSummary,,"Task C")
	var_Items.AddBar(hTask,"Task",{02/23/2001},{02/27/2001},"K3")
	' var_Items.ExpandItem(hSummary) = .t.
	oG2antt.TemplateDef = "dim var_Items,hSummary"
	oG2antt.TemplateDef = var_Items
	oG2antt.TemplateDef = hSummary
	oG2antt.Template = "var_Items.ExpandItem(hSummary) = True"

	var_Items.DefineSummaryBars(hSummary,"",-1,"<*>")
oG2antt.EndUpdate()
|
|
1852
|
How can I programmatically add more split panes ( by code)
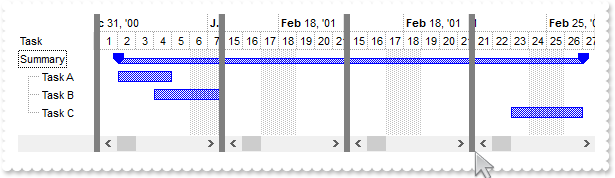
Dim hSummary as N
Dim hTask as N
Dim oG2antt as P
Dim var_Bar as P
Dim var_Chart as P
Dim var_Chart1 as P
Dim var_Items as P

oG2antt = topparent:CONTROL_ACTIVEX1.activex
oG2antt.BeginUpdate()
oG2antt.Columns.Add("Task")
oG2antt.Template = "Background(18) = 8421504" // oG2antt.Background(18) = 8421504
var_Chart = oG2antt.Chart
	var_Chart.LevelCount = 2
	' var_Chart.PaneWidth(.f.) = 76
	oG2antt.TemplateDef = "dim var_Chart"
	oG2antt.TemplateDef = var_Chart
	oG2antt.Template = "var_Chart.PaneWidth(False) = 76"

	var_Chart.FirstVisibleDate = {01/01/2001}
	var_Bar = var_Chart.Bars.Item("Summary")
		var_Bar.Pattern = 3
		var_Bar.Shape = 4
		var_Bar.Color = 16711680
		var_Bar.StartColor = var_Bar.Color
		var_Bar.EndColor = var_Bar.Color
	var_Chart.AllowSplitPane = 1
var_Items = oG2antt.Items
	hSummary = var_Items.AddItem("Summary")
	var_Items.AddBar(hSummary,"Summary",{01/02/2001},{01/02/2001},"")
	hTask = var_Items.InsertItem(hSummary,,"Task A")
	var_Items.AddBar(hTask,"Task",{01/02/2001},{01/05/2001},"K1")
	hTask = var_Items.InsertItem(hSummary,,"Task B")
	var_Items.AddBar(hTask,"Task",{01/04/2001},{01/08/2001},"K2")
	hTask = var_Items.InsertItem(hSummary,,"Task C")
	var_Items.AddBar(hTask,"Task",{02/23/2001},{02/27/2001},"K3")
	' var_Items.ExpandItem(hSummary) = .t.
	oG2antt.TemplateDef = "dim var_Items,hSummary"
	oG2antt.TemplateDef = var_Items
	oG2antt.TemplateDef = hSummary
	oG2antt.Template = "var_Items.ExpandItem(hSummary) = True"

	var_Items.DefineSummaryBars(hSummary,"",-1,"<*>")
var_Chart1 = oG2antt.Chart
	var_Chart1.ScrollTo(var_Chart1.EndPrintDate,1)
	var_Chart1.SplitPaneWidth = "128,128,128"
	var_Chart1.ScrollTo(var_Chart1.StartPrintDate,1)
oG2antt.EndUpdate()
|
|
1851
|
How can I programmatically add a split pane, or adding a split view at runtime
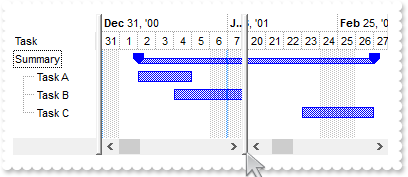
Dim hSummary as N
Dim hTask as N
Dim oG2antt as P
Dim var_Bar as P
Dim var_Chart as P
Dim var_Chart1 as P
Dim var_Items as P

oG2antt = topparent:CONTROL_ACTIVEX1.activex
oG2antt.BeginUpdate()
oG2antt.Columns.Add("Task")
oG2antt.Template = "Background(142) = 2631720" // oG2antt.Background(142) = 2631720
var_Chart = oG2antt.Chart
	var_Chart.LevelCount = 2
	' var_Chart.PaneWidth(.f.) = 76
	oG2antt.TemplateDef = "dim var_Chart"
	oG2antt.TemplateDef = var_Chart
	oG2antt.Template = "var_Chart.PaneWidth(False) = 76"

	var_Chart.FirstVisibleDate = {01/01/2001}
	var_Bar = var_Chart.Bars.Item("Summary")
		var_Bar.Pattern = 3
		var_Bar.Shape = 4
		var_Bar.Color = 16711680
		var_Bar.StartColor = var_Bar.Color
		var_Bar.EndColor = var_Bar.Color
	var_Chart.AllowSplitPane = 1
var_Items = oG2antt.Items
	hSummary = var_Items.AddItem("Summary")
	var_Items.AddBar(hSummary,"Summary",{01/02/2001},{01/02/2001},"")
	hTask = var_Items.InsertItem(hSummary,,"Task A")
	var_Items.AddBar(hTask,"Task",{01/02/2001},{01/05/2001},"K1")
	hTask = var_Items.InsertItem(hSummary,,"Task B")
	var_Items.AddBar(hTask,"Task",{01/04/2001},{01/08/2001},"K2")
	hTask = var_Items.InsertItem(hSummary,,"Task C")
	var_Items.AddBar(hTask,"Task",{02/23/2001},{02/27/2001},"K3")
	' var_Items.ExpandItem(hSummary) = .t.
	oG2antt.TemplateDef = "dim var_Items,hSummary"
	oG2antt.TemplateDef = var_Items
	oG2antt.TemplateDef = hSummary
	oG2antt.Template = "var_Items.ExpandItem(hSummary) = True"

	var_Items.DefineSummaryBars(hSummary,"",-1,"<*>")
var_Chart1 = oG2antt.Chart
	var_Chart1.ScrollTo(var_Chart1.EndPrintDate,1)
	var_Chart1.SplitPaneWidth = "128"
	var_Chart1.ScrollTo(var_Chart1.StartPrintDate,1)
oG2antt.EndUpdate()
|
|
1850
|
Is there any way, property, procedure or anything else to split the control into multiple views
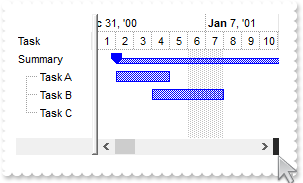
Dim hSummary as N
Dim hTask as N
Dim oG2antt as P
Dim var_Bar as P
Dim var_Chart as P
Dim var_Items as P

oG2antt = topparent:CONTROL_ACTIVEX1.activex
oG2antt.BeginUpdate()
oG2antt.Columns.Add("Task")
oG2antt.Template = "Background(142) = 2631720" // oG2antt.Background(142) = 2631720
var_Chart = oG2antt.Chart
	var_Chart.LevelCount = 2
	' var_Chart.PaneWidth(.f.) = 76
	oG2antt.TemplateDef = "dim var_Chart"
	oG2antt.TemplateDef = var_Chart
	oG2antt.Template = "var_Chart.PaneWidth(False) = 76"

	var_Chart.FirstVisibleDate = {01/01/2001}
	var_Bar = var_Chart.Bars.Item("Summary")
		var_Bar.Pattern = 3
		var_Bar.Shape = 4
		var_Bar.Color = 16711680
		var_Bar.StartColor = var_Bar.Color
		var_Bar.EndColor = var_Bar.Color
	var_Chart.AllowSplitPane = 1
var_Items = oG2antt.Items
	hSummary = var_Items.AddItem("Summary")
	var_Items.AddBar(hSummary,"Summary",{01/02/2001},{01/02/2001},"")
	hTask = var_Items.InsertItem(hSummary,,"Task A")
	var_Items.AddBar(hTask,"Task",{01/02/2001},{01/05/2001},"K1")
	hTask = var_Items.InsertItem(hSummary,,"Task B")
	var_Items.AddBar(hTask,"Task",{01/04/2001},{01/08/2001},"K2")
	hTask = var_Items.InsertItem(hSummary,,"Task C")
	var_Items.AddBar(hTask,"Task",{02/23/2001},{02/27/2001},"K3")
	' var_Items.ExpandItem(hSummary) = .t.
	oG2antt.TemplateDef = "dim var_Items,hSummary"
	oG2antt.TemplateDef = var_Items
	oG2antt.TemplateDef = hSummary
	oG2antt.Template = "var_Items.ExpandItem(hSummary) = True"

	var_Items.DefineSummaryBars(hSummary,"",-1,"<*>")
oG2antt.EndUpdate()
|
|
1849
|
It appears that I can not use the ItemFromPoint property in my environment. What else I can do
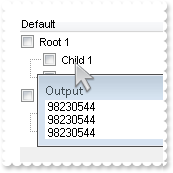
' Occurs when the user moves the mouse.
function MouseMove as v (Button  as  N, Shift  as  N, X  as  OLE::Exontrol.G2antt.1::OLE_XPOS_PIXELS, Y  as  OLE::Exontrol.G2antt.1::OLE_YPOS_PIXELS)
	oG2antt = topparent:CONTROL_ACTIVEX1.activex
	? oG2antt.ExecuteTemplate("Dim c, hit; ItemFromPoint(-1,-1, c, hit )")
end function

Dim h as N
Dim oG2antt as P
Dim var_Chart as local
Dim var_Column as P
Dim var_Items as P

oG2antt = topparent:CONTROL_ACTIVEX1.activex
oG2antt.BeginUpdate()
var_Column = oG2antt.Columns.Add("Default")
	' var_Column.Def(0) = .t.
	oG2antt.TemplateDef = "dim var_Column"
	oG2antt.TemplateDef = var_Column
	oG2antt.Template = "var_Column.Def(0) = True"

	var_Column.PartialCheck = .t.
' oG2antt.Chart.PaneWidth(.t.) = 0
var_Chart = oG2antt.Chart
oG2antt.TemplateDef = "dim var_Chart"
oG2antt.TemplateDef = var_Chart
oG2antt.Template = "var_Chart.PaneWidth(True) = 0"

var_Items = oG2antt.Items
	h = var_Items.AddItem("Root 1")
	var_Items.InsertItem(h,,"Child 1")
	var_Items.InsertItem(h,,"Child 2")
	' var_Items.ExpandItem(h) = .t.
	oG2antt.TemplateDef = "dim var_Items,h"
	oG2antt.TemplateDef = var_Items
	oG2antt.TemplateDef = h
	oG2antt.Template = "var_Items.ExpandItem(h) = True"

	h = var_Items.AddItem("Root 2")
	var_Items.InsertItem(h,,"Child 1")
	var_Items.InsertItem(h,,"Child 2")
	' var_Items.ExpandItem(h) = .t.
	oG2antt.TemplateDef = "dim var_Items,h"
	oG2antt.TemplateDef = var_Items
	oG2antt.TemplateDef = h
	oG2antt.Template = "var_Items.ExpandItem(h) = True"

oG2antt.EndUpdate()
|
|
1848
|
How can I change the color for selected links (ebn)
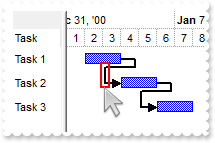
Dim h1 as N
Dim h2 as N
Dim h3 as N
Dim oG2antt as P
Dim var_Appearance as P
Dim var_Chart as P
Dim var_Items as P

oG2antt = topparent:CONTROL_ACTIVEX1.activex
oG2antt.BeginUpdate()
var_Appearance = oG2antt.VisualAppearance
	var_Appearance.RenderType = -2
	var_Appearance.Add(1,"gBFLBCJwBAEHhEJAEGg4BNkMQAAYAQGKIYBkAKBQAGaAoDDYNQwQwAAwjIKEEwsACEIrjKCVIgkHYJRjGEZxMAsEwjAoaQChEZRUhEMgxDDIIxAJIcaw0GSEZwgOQZBiOEYnDANMgzDLMZR7DajYymSA6LiKNo+QjKFB0NLMVRtEIIIzCSCaNomT4DS4NIi2DYcVhhMqBYbtCZZBo2FpZUxXdL0BJMVxbHKYJikW4pVjoAJ+TxccjVDQNJyLQ6rYzuAAKNpuO58RbdGDQHA9KyfLCEcTxYAMbp6X5kaBZVp2VCMRzbTLUIDzPNVCTrNIaJioAaMeiCG5NUzieqRNalLABFjZMIHDbtGynDIJZruW52+CLIZpWbEOiRXr2TxxgGYp5Fie5mAYBgIgSFDrDOIZUmQZYiECXJUjIEQ3lUGgbEIRQcg+Hg8DEFxYFuOR/i+X5znufh/omBgCgCVwjn4BoBmCCAmAqApgkefgMgOYQID4DoELsUgTgUYYIC4F4GGGSAaBuBxhhgfgggUYgog4EYJGIaBJn6ChiBiLgsgkIpoj4J4BCMSJWDaDZjgiZgCEAQCAgA==")
	var_Appearance.Add(2,"CP:1 -2 -2 2 2")
oG2antt.DefaultItemHeight = 24
oG2antt.Columns.Add("Task")
var_Chart = oG2antt.Chart
	var_Chart.LevelCount = 2
	var_Chart.FirstVisibleDate = {01/01/2001}
	' var_Chart.PaneWidth(.f.) = 48
	oG2antt.TemplateDef = "dim var_Chart"
	oG2antt.TemplateDef = var_Chart
	oG2antt.Template = "var_Chart.PaneWidth(False) = 48"

	var_Chart.NonworkingDays = 0
	var_Chart.LinksStyle = 0
	var_Chart.LinksWidth = 2
	var_Chart.SelLinkColor = 33554687
var_Items = oG2antt.Items
	h1 = var_Items.AddItem("Task 1")
	var_Items.AddBar(h1,"Task",{01/02/2001},{01/04/2001},"")
	h2 = var_Items.AddItem("Task 2")
	var_Items.AddBar(h2,"Task",{01/02/2001},{01/04/2001},"")
	var_Items.AddLink("L1",h1,"",h2,"")
	' var_Items.Link("L1",257) = .t.
	oG2antt.TemplateDef = "dim var_Items"
	oG2antt.TemplateDef = var_Items
	oG2antt.Template = "var_Items.Link(`L1`,257) = True"

	h3 = var_Items.AddItem("Task 3")
	var_Items.AddBar(h3,"Task",{01/02/2001},{01/04/2001},"")
	var_Items.AddLink("L2",h2,"",h3,"")
	var_Items.SchedulePDM(0,"")
oG2antt.EndUpdate()
|
|
1847
|
How can I change the color for selected links (color, no frame)
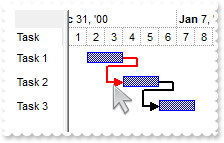
Dim h1 as N
Dim h2 as N
Dim h3 as N
Dim oG2antt as P
Dim var_Chart as P
Dim var_Items as P

oG2antt = topparent:CONTROL_ACTIVEX1.activex
oG2antt.BeginUpdate()
oG2antt.DefaultItemHeight = 24
oG2antt.Columns.Add("Task")
var_Chart = oG2antt.Chart
	var_Chart.LevelCount = 2
	var_Chart.FirstVisibleDate = {01/01/2001}
	' var_Chart.PaneWidth(.f.) = 48
	oG2antt.TemplateDef = "dim var_Chart"
	oG2antt.TemplateDef = var_Chart
	oG2antt.Template = "var_Chart.PaneWidth(False) = 48"

	var_Chart.NonworkingDays = 0
	var_Chart.LinksStyle = 0
	var_Chart.LinksWidth = 2
	var_Chart.SelLinkColor = 2130706687
var_Items = oG2antt.Items
	h1 = var_Items.AddItem("Task 1")
	var_Items.AddBar(h1,"Task",{01/02/2001},{01/04/2001},"")
	h2 = var_Items.AddItem("Task 2")
	var_Items.AddBar(h2,"Task",{01/02/2001},{01/04/2001},"")
	var_Items.AddLink("L1",h1,"",h2,"")
	' var_Items.Link("L1",257) = .t.
	oG2antt.TemplateDef = "dim var_Items"
	oG2antt.TemplateDef = var_Items
	oG2antt.Template = "var_Items.Link(`L1`,257) = True"

	h3 = var_Items.AddItem("Task 3")
	var_Items.AddBar(h3,"Task",{01/02/2001},{01/04/2001},"")
	var_Items.AddLink("L2",h2,"",h3,"")
	var_Items.SchedulePDM(0,"")
oG2antt.EndUpdate()
|
|
1846
|
How can I change the color for selected links (color, frame)
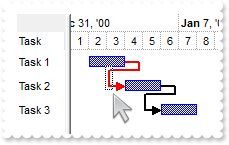
Dim h1 as N
Dim h2 as N
Dim h3 as N
Dim oG2antt as P
Dim var_Chart as P
Dim var_Items as P

oG2antt = topparent:CONTROL_ACTIVEX1.activex
oG2antt.BeginUpdate()
oG2antt.DefaultItemHeight = 24
oG2antt.Columns.Add("Task")
var_Chart = oG2antt.Chart
	var_Chart.LevelCount = 2
	var_Chart.FirstVisibleDate = {01/01/2001}
	' var_Chart.PaneWidth(.f.) = 48
	oG2antt.TemplateDef = "dim var_Chart"
	oG2antt.TemplateDef = var_Chart
	oG2antt.Template = "var_Chart.PaneWidth(False) = 48"

	var_Chart.NonworkingDays = 0
	var_Chart.LinksStyle = 0
	var_Chart.LinksWidth = 2
	var_Chart.SelLinkColor = 255
var_Items = oG2antt.Items
	h1 = var_Items.AddItem("Task 1")
	var_Items.AddBar(h1,"Task",{01/02/2001},{01/04/2001},"")
	h2 = var_Items.AddItem("Task 2")
	var_Items.AddBar(h2,"Task",{01/02/2001},{01/04/2001},"")
	var_Items.AddLink("L1",h1,"",h2,"")
	' var_Items.Link("L1",257) = .t.
	oG2antt.TemplateDef = "dim var_Items"
	oG2antt.TemplateDef = var_Items
	oG2antt.Template = "var_Items.Link(`L1`,257) = True"

	h3 = var_Items.AddItem("Task 3")
	var_Items.AddBar(h3,"Task",{01/02/2001},{01/04/2001},"")
	var_Items.AddLink("L2",h2,"",h3,"")
	var_Items.SchedulePDM(0,"")
oG2antt.EndUpdate()
|
|
1845
|
By default, the bar gets selected once the user releases the button of the mouse. Is it possible to change this behavior so the bar gets selected once the user presses the button of the mouse
' Occurs when the user presses a mouse button.
function MouseDown as v (Button  as  N, Shift  as  N, X  as  OLE::Exontrol.G2antt.1::OLE_XPOS_PIXELS, Y  as  OLE::Exontrol.G2antt.1::OLE_YPOS_PIXELS)
	Dim b as
	Dim h as N
	Dim var_Items as P
	oG2antt = topparent:CONTROL_ACTIVEX1.activex
	h = oG2antt.ItemFromPoint(-1,-1,c,hit)
	b = oG2antt.Chart.BarFromPoint(-1,-1)
	var_Items = oG2antt.Items
		' var_Items.ItemBar(0,"<*>",257) = .f.
		oG2antt.TemplateDef = "dim var_Items"
		oG2antt.TemplateDef = var_Items
		oG2antt.Template = "var_Items.ItemBar(0,`<*>`,257) = False"
		' var_Items.ItemBar(h,b,257) = .t.
		oG2antt.TemplateDef = "dim var_Items,h,b"
		oG2antt.TemplateDef = var_Items
		oG2antt.TemplateDef = h
		oG2antt.TemplateDef = b
		oG2antt.Template = "var_Items.ItemBar(h,b,257) = True"

end function

Dim h as N
Dim oG2antt as P
Dim var_Appearance as P
Dim var_Chart as P
Dim var_Items as P

oG2antt = topparent:CONTROL_ACTIVEX1.activex
oG2antt.BeginUpdate()
oG2antt.DefaultItemHeight = 32
var_Appearance = oG2antt.VisualAppearance
	var_Appearance.Add(1,"gBFLBCJwBAEHhEJAEGg4BNkMQAAYAQGKIYBkAKBQAGaAoDDYNQwQwAAwjIKEEwsACEIrjKCVIgkHYJRjGEZxMAsEwjAoaQChEZRUhEMgxDDIIxAJIcaw0GSEZwgOQZBiOEYnDANMgzDLMZR7DajYymSA6LiKNo+QjKFB0NLMVRtEIIIzCSCaNomT4DS4NIi2DYcVhhMqBYbtCZZBo2FpZUxXdL0BJMVxbHKYJikW4pVjoAJ+TxccjVDQNJyLQ6rYzuAAKNpuO58RbdGDQHA9KyfLCEcTxYAMbp6X5kaBZVp2VCMRzbTLUIDzPNVCTrNIaJioAaMeiCG5NUzieqRNalLABFjZMIHDbtGynDIJZruW52+CLIZpWbEOiRXr2TxxgGYp5Fie5mAYBgIgSFDrDOIZUmQZYiECXJUjIEQ3lUGgbEIRQcg+Hg8DEFxYFuOR/i+X5znufh/omBgCgCVwjn4BoBmCCAmAqApgkefgMgOYQID4DoELsUgTgUYYIC4F4GGGSAaBuBxhhgfgggUYgog4EYJGIaBJn6ChiBiLgsgkIpoj4J4BCMSJWDaDZjgiZgCEAQCAgA==")
	var_Appearance.Add(2,"CP:1 -2 -2 2 2")
var_Chart = oG2antt.Chart
	var_Chart.AllowSelectObjects = 0
	var_Chart.FirstVisibleDate = {01/01/2002}
	var_Chart.SelBarColor = 33554432
	' var_Chart.PaneWidth(.f.) = 48
	oG2antt.TemplateDef = "dim var_Chart"
	oG2antt.TemplateDef = var_Chart
	oG2antt.Template = "var_Chart.PaneWidth(0) = 48"

oG2antt.Columns.Add("Task")
var_Items = oG2antt.Items
	h = var_Items.AddItem("Task")
	var_Items.AddBar(h,"Task",{01/02/2002},{01/04/2002},"A")
	var_Items.AddBar(h,"Task",{01/06/2002},{01/10/2002},"B")
	var_Items.AddBar(h,"Task",{01/11/2002},{01/14/2002},"C")
	' var_Items.ItemBar(h,"B",257) = .t.
	oG2antt.TemplateDef = "dim var_Items,h"
	oG2antt.TemplateDef = var_Items
	oG2antt.TemplateDef = h
	oG2antt.Template = "var_Items.ItemBar(h,`B`,257) = True"

oG2antt.EndUpdate()
|
|
1844
|
How can I change the bar's color (sample 3, ebn, individual, global)
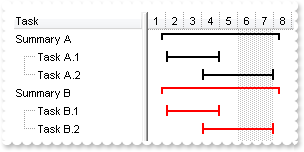
Dim hSummaryJ as N
Dim hSummaryK as N
Dim hTaskJ as N
Dim hTaskK as N
Dim oG2antt as P
Dim var_Appearance as P
Dim var_Bar as P
Dim var_Bar1 as P
Dim var_Chart as P
Dim var_Items as P

oG2antt = topparent:CONTROL_ACTIVEX1.activex
oG2antt.BeginUpdate()
var_Appearance = oG2antt.VisualAppearance
	var_Appearance.RenderType = -2
	var_Appearance.Add(1,"gBFLBCJwBAEHhEJAAEhABN0GACAADACAxRDAMgBQKAAzQFAYahuGSGAAGMYxQgmFgAQhFcZQSKUOQTDKMIziYBYJhEMQyDAAUIjOKsIhkGYcZAGQBJCjWGodQLOEgwHIERQjEyUJAGGQIHhyPYbUbGUpQHKkeRtGqgBgoKhKEouNYgAbGYIwTRsdyfDSXBpEWwbDgkNQwWTDNoRDIUQStCysaYjOpnfrUAJ1P7FdQ1NJkXRhGSSK7maapaiCSZ6STCMj1FhVKSNJ7DQKhGpgKh/ApgYpQOK4fLNXyRBK4QAyKA6bgPFZOZbFViaXY1V5bNKrcjhHQwAyHJ4XXRdV4YRAkUT4GqiJKGSYcQhuXZWbRqO6ABhef6DRThc6jKpFHIE4llEcojHqSZNgoIxnlgd5thsLREleL43gsYZ9BkaAYkMAgAm+CxGDWWAtiKCRfjcdRgHoHYnicUwgAIEIREAaQYkcQZUHIGRUDQJBOEYRAhDYCxGgMZAkCgdYQhaXQIAYERwQuahXggdgeG6VZ4H4IhdiIGIOB8YIiGiHZZgqYpGF4KYHiKCI+CAU5jCiTQ2g0YhEFyax4gABAEIC")
	var_Appearance.Add(2,"gBFLBCJwBAEHhEJAAEhABU0IQAAYAQGKQYhiAKBQAGaAoDDcMA4QwAAyjAKMEwsACEIrjKCRShyCYZRhGcTAJBMIhiGQYAChEZxVhEMgzDjIAxSJAcQRFESaAABGCQGh+N4/S4NIi0CIsZQjCaiZ7pKA5bgMCo+UrNMixZQVCSOGChYRpCaZWpGGodQRUFbVHAlKypJKCKrEWSrDhuYAAW7XM7yBS1TzVNSuLZtaLqSroAJ1WTWMB0Ra8NzZEKfaZACj4arKejrRDCMAggI=")
oG2antt.Columns.Add("Task")
var_Chart = oG2antt.Chart
	' var_Chart.PaneWidth(.f.) = 128
	oG2antt.TemplateDef = "dim var_Chart"
	oG2antt.TemplateDef = var_Chart
	oG2antt.Template = "var_Chart.PaneWidth(False) = 128"

	var_Chart.FirstVisibleDate = {01/01/2001}
	var_Bar = var_Chart.Bars.Item("Task")
		' var_Bar.Def(4) = 18
		oG2antt.TemplateDef = "dim var_Bar"
		oG2antt.TemplateDef = var_Bar
		oG2antt.Template = "var_Bar.Def(4) = 18"

		var_Bar.Color = 16777216
	var_Bar1 = var_Chart.Bars.Item("Summary")
		' var_Bar1.Def(4) = 18
		oG2antt.TemplateDef = "dim var_Bar1"
		oG2antt.TemplateDef = var_Bar1
		oG2antt.Template = "var_Bar1.Def(4) = 18"

		var_Bar1.Color = 33554432
var_Items = oG2antt.Items
	hSummaryJ = var_Items.AddItem("Summary A")
	var_Items.AddBar(hSummaryJ,"Summary",{01/02/2001},{01/02/2001},"J")
	hTaskJ = var_Items.InsertItem(hSummaryJ,,"Task A.1")
	var_Items.AddBar(hTaskJ,"Task",{01/02/2001},{01/05/2001},"J1")
	hTaskJ = var_Items.InsertItem(hSummaryJ,,"Task A.2")
	var_Items.AddBar(hTaskJ,"Task",{01/04/2001},{01/08/2001},"J2")
	var_Items.DefineSummaryBars(hSummaryJ,"J",-1,"<*>")
	hSummaryK = var_Items.AddItem("Summary B")
	var_Items.AddBar(hSummaryK,"Summary",{01/02/2001},{01/02/2001},"K")
	hTaskK = var_Items.InsertItem(hSummaryK,,"Task B.1")
	var_Items.AddBar(hTaskK,"Task",{01/02/2001},{01/05/2001},"K1")
	hTaskK = var_Items.InsertItem(hSummaryK,,"Task B.2")
	var_Items.AddBar(hTaskK,"Task",{01/04/2001},{01/08/2001},"K2")
	var_Items.DefineSummaryBars(hSummaryK,"K",-1,"<*>")
	' var_Items.ItemBar(0,"<K*>",33) = 255
	oG2antt.TemplateDef = "dim var_Items"
	oG2antt.TemplateDef = var_Items
	oG2antt.Template = "var_Items.ItemBar(0,`<K*>`,33) = 255"

	' var_Items.ExpandItem(0) = .t.
	oG2antt.TemplateDef = "dim var_Items"
	oG2antt.TemplateDef = var_Items
	oG2antt.Template = "var_Items.ExpandItem(0) = True"

oG2antt.EndUpdate()
|
|
1843
|
How can I change the bar's color (sample 2, global)
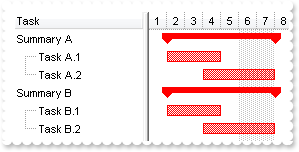
Dim hSummaryJ as N
Dim hSummaryK as N
Dim hTaskJ as N
Dim hTaskK as N
Dim oG2antt as P
Dim var_Bar as P
Dim var_Bar1 as P
Dim var_Chart as P
Dim var_Items as P

oG2antt = topparent:CONTROL_ACTIVEX1.activex
oG2antt.BeginUpdate()
oG2antt.Columns.Add("Task")
var_Chart = oG2antt.Chart
	' var_Chart.PaneWidth(.f.) = 128
	oG2antt.TemplateDef = "dim var_Chart"
	oG2antt.TemplateDef = var_Chart
	oG2antt.Template = "var_Chart.PaneWidth(False) = 128"

	var_Chart.FirstVisibleDate = {01/01/2001}
	var_Bar = var_Chart.Bars.Item("Task")
		' var_Bar.Def(4) = 18
		oG2antt.TemplateDef = "dim var_Bar"
		oG2antt.TemplateDef = var_Bar
		oG2antt.Template = "var_Bar.Def(4) = 18"

		var_Bar.Color = 255
	var_Bar1 = var_Chart.Bars.Item("Summary")
		' var_Bar1.Def(4) = 18
		oG2antt.TemplateDef = "dim var_Bar1"
		oG2antt.TemplateDef = var_Bar1
		oG2antt.Template = "var_Bar1.Def(4) = 18"

		var_Bar1.Color = 255
		var_Bar1.StartColor = var_Bar1.Color
		var_Bar1.EndColor = var_Bar1.Color
var_Items = oG2antt.Items
	hSummaryJ = var_Items.AddItem("Summary A")
	var_Items.AddBar(hSummaryJ,"Summary",{01/02/2001},{01/02/2001},"J")
	hTaskJ = var_Items.InsertItem(hSummaryJ,,"Task A.1")
	var_Items.AddBar(hTaskJ,"Task",{01/02/2001},{01/05/2001},"J1")
	hTaskJ = var_Items.InsertItem(hSummaryJ,,"Task A.2")
	var_Items.AddBar(hTaskJ,"Task",{01/04/2001},{01/08/2001},"J2")
	var_Items.DefineSummaryBars(hSummaryJ,"J",-1,"<*>")
	hSummaryK = var_Items.AddItem("Summary B")
	var_Items.AddBar(hSummaryK,"Summary",{01/02/2001},{01/02/2001},"K")
	hTaskK = var_Items.InsertItem(hSummaryK,,"Task B.1")
	var_Items.AddBar(hTaskK,"Task",{01/02/2001},{01/05/2001},"K1")
	hTaskK = var_Items.InsertItem(hSummaryK,,"Task B.2")
	var_Items.AddBar(hTaskK,"Task",{01/04/2001},{01/08/2001},"K2")
	var_Items.DefineSummaryBars(hSummaryK,"K",-1,"<*>")
	' var_Items.ExpandItem(0) = .t.
	oG2antt.TemplateDef = "dim var_Items"
	oG2antt.TemplateDef = var_Items
	oG2antt.Template = "var_Items.ExpandItem(0) = True"

oG2antt.EndUpdate()
|
|
1842
|
How can I change the bar's color (sample 1, individual)
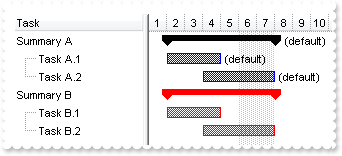
Dim hSummaryJ as N
Dim hSummaryK as N
Dim hTaskJ as N
Dim hTaskK as N
Dim oG2antt as P
Dim var_Bars as local
Dim var_Bars1 as local
Dim var_Chart as P
Dim var_Items as P

oG2antt = topparent:CONTROL_ACTIVEX1.activex
oG2antt.BeginUpdate()
oG2antt.Columns.Add("Task")
var_Chart = oG2antt.Chart
	' var_Chart.PaneWidth(.f.) = 128
	oG2antt.TemplateDef = "dim var_Chart"
	oG2antt.TemplateDef = var_Chart
	oG2antt.Template = "var_Chart.PaneWidth(False) = 128"

	var_Chart.FirstVisibleDate = {01/01/2001}
	' var_Chart.Bars.Item("Task").Def(4) = 18
	var_Bars = var_Chart.Bars.Item("Task")
	oG2antt.TemplateDef = "dim var_Bars"
	oG2antt.TemplateDef = var_Bars
	oG2antt.Template = "var_Bars.Def(4) = 18"

	' var_Chart.Bars.Item("Summary").Def(4) = 18
	var_Bars1 = var_Chart.Bars.Item("Summary")
	oG2antt.TemplateDef = "dim var_Bars1"
	oG2antt.TemplateDef = var_Bars1
	oG2antt.Template = "var_Bars1.Def(4) = 18"

var_Items = oG2antt.Items
	hSummaryJ = var_Items.AddItem("Summary A")
	var_Items.AddBar(hSummaryJ,"Summary",{01/02/2001},{01/02/2001},"J","  (default)")
	hTaskJ = var_Items.InsertItem(hSummaryJ,,"Task A.1")
	var_Items.AddBar(hTaskJ,"Task",{01/02/2001},{01/05/2001},"J1","(default)")
	hTaskJ = var_Items.InsertItem(hSummaryJ,,"Task A.2")
	var_Items.AddBar(hTaskJ,"Task",{01/04/2001},{01/08/2001},"J2","(default)")
	var_Items.DefineSummaryBars(hSummaryJ,"J",-1,"<*>")
	hSummaryK = var_Items.AddItem("Summary B")
	var_Items.AddBar(hSummaryK,"Summary",{01/02/2001},{01/02/2001},"K")
	hTaskK = var_Items.InsertItem(hSummaryK,,"Task B.1")
	var_Items.AddBar(hTaskK,"Task",{01/02/2001},{01/05/2001},"K1")
	hTaskK = var_Items.InsertItem(hSummaryK,,"Task B.2")
	var_Items.AddBar(hTaskK,"Task",{01/04/2001},{01/08/2001},"K2")
	var_Items.DefineSummaryBars(hSummaryK,"K",-1,"<*>")
	' var_Items.ItemBar(hSummaryK,"",33) = 255
	oG2antt.TemplateDef = "dim var_Items,hSummaryK"
	oG2antt.TemplateDef = var_Items
	oG2antt.TemplateDef = hSummaryK
	oG2antt.Template = "var_Items.ItemBar(hSummaryK,``,33) = 255"

	' var_Items.ItemBar(0,"<K*>",33) = 255
	oG2antt.TemplateDef = "dim var_Items"
	oG2antt.TemplateDef = var_Items
	oG2antt.Template = "var_Items.ItemBar(0,`<K*>`,33) = 255"

	' var_Items.ExpandItem(0) = .t.
	oG2antt.TemplateDef = "dim var_Items"
	oG2antt.TemplateDef = var_Items
	oG2antt.Template = "var_Items.ExpandItem(0) = True"

oG2antt.EndUpdate()
|
|
1841
|
How do I make the control read-only (method 2)
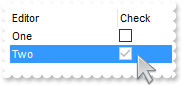
' Occurs just before editing the focused cell.
function Edit as v (Item  as  OLE::Exontrol.G2antt.1::HITEM, ColIndex  as  N, Cancel  as  L)
	oG2antt = topparent:CONTROL_ACTIVEX1.activex
	Cancel = .t.
end function

Dim oG2antt as P
Dim var_Column as P
Dim var_Editor as P
Dim var_Editor1 as P
Dim var_Items as P

oG2antt = topparent:CONTROL_ACTIVEX1.activex
oG2antt.BeginUpdate()
var_Editor = oG2antt.Columns.Add("Editor").Editor
	var_Editor.EditType = 6
	var_Editor.AddItem(1,"One")
	var_Editor.AddItem(2,"Two")
var_Column = oG2antt.Columns.Add("Check")
	var_Editor1 = var_Column.Editor
		var_Editor1.EditType = 19
		' var_Editor1.Option(16) = 2
		oG2antt.TemplateDef = "dim var_Editor1"
		oG2antt.TemplateDef = var_Editor1
		oG2antt.Template = "var_Editor1.Option(16) = 2"

var_Items = oG2antt.Items
	' var_Items.CellValue(var_Items.AddItem(1),1) = 0
	oG2antt.TemplateDef = "dim var_Items"
	oG2antt.TemplateDef = var_Items
	oG2antt.Template = "var_Items.CellValue(AddItem(1),1) = 0"

	' var_Items.CellValue(var_Items.AddItem(2),1) = 1
	oG2antt.TemplateDef = "dim var_Items"
	oG2antt.TemplateDef = var_Items
	oG2antt.Template = "var_Items.CellValue(AddItem(2),1) = 1"

oG2antt.EndUpdate()
|
|
1840
|
How do I make the control read-only (method 1)
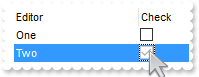
Dim oG2antt as P
Dim var_Column as P
Dim var_Editor as P
Dim var_Editor1 as P
Dim var_Items as P

oG2antt = topparent:CONTROL_ACTIVEX1.activex
oG2antt.BeginUpdate()
oG2antt.ReadOnly = -1
var_Editor = oG2antt.Columns.Add("Editor").Editor
	var_Editor.EditType = 6
	var_Editor.AddItem(1,"One")
	var_Editor.AddItem(2,"Two")
var_Column = oG2antt.Columns.Add("Check")
	var_Editor1 = var_Column.Editor
		var_Editor1.EditType = 19
		' var_Editor1.Option(16) = 2
		oG2antt.TemplateDef = "dim var_Editor1"
		oG2antt.TemplateDef = var_Editor1
		oG2antt.Template = "var_Editor1.Option(16) = 2"

var_Items = oG2antt.Items
	' var_Items.CellValue(var_Items.AddItem(1),1) = 0
	oG2antt.TemplateDef = "dim var_Items"
	oG2antt.TemplateDef = var_Items
	oG2antt.Template = "var_Items.CellValue(AddItem(1),1) = 0"

	' var_Items.CellValue(var_Items.AddItem(2),1) = 1
	oG2antt.TemplateDef = "dim var_Items"
	oG2antt.TemplateDef = var_Items
	oG2antt.Template = "var_Items.CellValue(AddItem(2),1) = 1"

oG2antt.EndUpdate()
|
|
1839
|
The ReadOnly property does not prevent changing the column's check-box (sample 2)
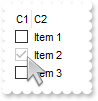
Dim oG2antt as P
Dim var_Column as P
Dim var_Editor as local
Dim var_Items as P

oG2antt = topparent:CONTROL_ACTIVEX1.activex
oG2antt.BeginUpdate()
oG2antt.ShowFocusRect = .f.
var_Column = oG2antt.Columns.Add("C1")
	var_Column.AllowSizing = .f.
	var_Column.Width = 18
	var_Column.Editor.EditType = 19
oG2antt.Columns.Add("C2")
var_Items = oG2antt.Items
	' var_Items.CellValue(var_Items.AddItem(0),1) = "Item 1"
	oG2antt.TemplateDef = "dim var_Items"
	oG2antt.TemplateDef = var_Items
	oG2antt.Template = "var_Items.CellValue(AddItem(0),1) = `Item 1`"

	' var_Items.CellValue(var_Items.AddItem(-1),1) = "Item 2"
	oG2antt.TemplateDef = "dim var_Items"
	oG2antt.TemplateDef = var_Items
	oG2antt.Template = "var_Items.CellValue(AddItem(-1),1) = `Item 2`"

	' var_Items.CellValue(var_Items.AddItem(0),1) = "Item 3"
	oG2antt.TemplateDef = "dim var_Items"
	oG2antt.TemplateDef = var_Items
	oG2antt.Template = "var_Items.CellValue(AddItem(0),1) = `Item 3`"

oG2antt.ReadOnly = .t.
' oG2antt.Columns.Item(0).Editor.Option(17) = 2
var_Editor = oG2antt.Columns.Item(0).Editor
oG2antt.TemplateDef = "dim var_Editor"
oG2antt.TemplateDef = var_Editor
oG2antt.Template = "var_Editor.Option(17) = 2"

oG2antt.EndUpdate()
|
|
1838
|
The ReadOnly property does not prevent changing the column's check-box (sample 1)
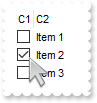
Dim oG2antt as P
Dim var_Column as P
Dim var_Editor as P
Dim var_Items as P

oG2antt = topparent:CONTROL_ACTIVEX1.activex
oG2antt.BeginUpdate()
oG2antt.ShowFocusRect = .f.
var_Column = oG2antt.Columns.Add("C1")
	var_Column.AllowSizing = .f.
	var_Column.Width = 18
	var_Editor = var_Column.Editor
		var_Editor.EditType = 19
		' var_Editor.Option(17) = 1
		oG2antt.TemplateDef = "dim var_Editor"
		oG2antt.TemplateDef = var_Editor
		oG2antt.Template = "var_Editor.Option(17) = 1"

oG2antt.Columns.Add("C2")
var_Items = oG2antt.Items
	' var_Items.CellValue(var_Items.AddItem(0),1) = "Item 1"
	oG2antt.TemplateDef = "dim var_Items"
	oG2antt.TemplateDef = var_Items
	oG2antt.Template = "var_Items.CellValue(AddItem(0),1) = `Item 1`"

	' var_Items.CellValue(var_Items.AddItem(-1),1) = "Item 2"
	oG2antt.TemplateDef = "dim var_Items"
	oG2antt.TemplateDef = var_Items
	oG2antt.Template = "var_Items.CellValue(AddItem(-1),1) = `Item 2`"

	' var_Items.CellValue(var_Items.AddItem(0),1) = "Item 3"
	oG2antt.TemplateDef = "dim var_Items"
	oG2antt.TemplateDef = var_Items
	oG2antt.Template = "var_Items.CellValue(AddItem(0),1) = `Item 3`"

oG2antt.ReadOnly = .t.
oG2antt.EndUpdate()
|
|
1837
|
How can I change the visual appearance of the control's split bar (sample 3)
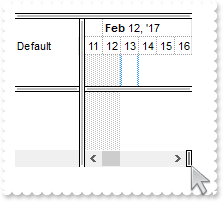
Dim oG2antt as P
Dim var_Appearance as P
Dim var_Chart as P

oG2antt = topparent:CONTROL_ACTIVEX1.activex
oG2antt.BeginUpdate()
oG2antt.Columns.Add("Default")
var_Appearance = oG2antt.VisualAppearance
	var_Appearance.Add(1,"gBFLBCJwBAEHhEJAAEhABPsIQAAYAQGKQYhiAKBQAGaAoDDcMA4QwAAyjAKMEwsACEIrjKCRShyCYZRrGUQxCKIZhzEgYRokAYYRDIMg5SBIETzFIMCQ9AaaJpieRJGiiKoJSxHErgFD8QxzEKOZqnCapViAMpOAZQAwDAIoWhpKKBRhqOpRUhaID/WAAFCUZK4ASTDCyLRgNy4lACgI")
	var_Appearance.Add(2,"gBFLBCJwBAEHhEJAAEhABPkIQAAYAQGKQYhiAKBQAGaAoDDcMA4QwAAyjAKMEwsACEIrjKCRShyCYZRrGUQxCKIZhzEgYRoiEYhXDiIAxARHcgyBIMPQJGSaZpkSRpIiqHItS6BM4RVKkcw7G6BaJnGJpADKTQGQiMIwDAIoWhpKCBaiqSpqMglf5fg6pOJqHACZZKWLNLpxDBMAkBA=")
	var_Appearance.Add(3,"gBFLBCJwBAEHhEJAAEhABUUIQAAYAQGKQYhiAKBQAGaAoDDcMA4QwAAyjAKMEwsACEIrjKCRShyCYZRrGQCwTCIYhmHKSRhGSIRSDcOIgDCBEbyDIEQw9AiZZqmaRZHimK4cS5MEhwHKsLSLGyOZwoSapbgmJooU5KUwSYKQcxBI6laYpIAKJhiWobTxUEBwMKlJw5KoBJxjKqIbp2XZsUxIAxXEA1HBgGASRZGS5bDreeQ0UZCL74GAFUy/Liba6weqnLhGCYBgIA==")
oG2antt.Template = "Background(18) = 25198720" // oG2antt.Background(18) = 25198720
oG2antt.Template = "Background(141) = 41975936" // oG2antt.Background(141) = 41975936
oG2antt.Template = "Background(142) = 50397441" // oG2antt.Background(142) = 50397441
oG2antt.BackColorLevelHeader = oG2antt.BackColor
var_Chart = oG2antt.Chart
	var_Chart.LevelCount = 2
	' var_Chart.PaneWidth(.f.) = 64
	oG2antt.TemplateDef = "dim var_Chart"
	oG2antt.TemplateDef = var_Chart
	oG2antt.Template = "var_Chart.PaneWidth(False) = 64"

	var_Chart.HistogramVisible = .t.
	var_Chart.HistogramHeight = 64
	var_Chart.OverviewHeight = 48
	var_Chart.OverviewVisible = -1
oG2antt.EndUpdate()
|
|
1836
|
How can I change the color for the control's split bar (sample 2)
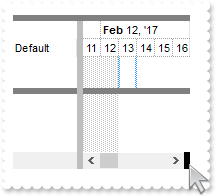
Dim oG2antt as P
Dim var_Chart as P

oG2antt = topparent:CONTROL_ACTIVEX1.activex
oG2antt.BeginUpdate()
oG2antt.Columns.Add("Default")
oG2antt.Template = "Background(18) = 12500670" // oG2antt.Background(18) = 12500670
oG2antt.Template = "Background(141) = 8421504" // oG2antt.Background(141) = 8421504
oG2antt.Template = "Background(142) = 65536" // oG2antt.Background(142) = 65536
oG2antt.BackColorLevelHeader = oG2antt.BackColor
var_Chart = oG2antt.Chart
	var_Chart.LevelCount = 2
	' var_Chart.PaneWidth(.f.) = 64
	oG2antt.TemplateDef = "dim var_Chart"
	oG2antt.TemplateDef = var_Chart
	oG2antt.Template = "var_Chart.PaneWidth(False) = 64"

	var_Chart.HistogramVisible = .t.
	var_Chart.HistogramHeight = 64
	var_Chart.OverviewHeight = 48
	var_Chart.OverviewVisible = -1
oG2antt.EndUpdate()
|
|
1835
|
How do I highlight a bar with an icon, exclamation mark or some warning sign, without using exBarCaption, exBarExtraCaption which I've already use for something else ( sample 2 )
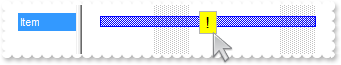
Dim h as N
Dim oG2antt as P
Dim var_Chart as P
Dim var_Items as P
Dim var_Note as P
Dim var_Notes as P

oG2antt = topparent:CONTROL_ACTIVEX1.activex
oG2antt.BeginUpdate()
var_Chart = oG2antt.Chart
	var_Chart.FirstVisibleDate = {12/26/2000}
	' var_Chart.PaneWidth(.f.) = 128
	oG2antt.TemplateDef = "dim var_Chart"
	oG2antt.TemplateDef = var_Chart
	oG2antt.Template = "var_Chart.PaneWidth(False) = 128"

oG2antt.Columns.Add("Column")
var_Items = oG2antt.Items
	var_Items.AddItem("")
	h = var_Items.AddItem("Item")
	var_Items.AddItem("")
	var_Items.AddBar(h,"Task",{01/01/2001},{01/13/2001},"A")
var_Notes = oG2antt.Chart.Notes
	var_Note = var_Notes.Add("Attention",oG2antt.Items.ItemByIndex(1),"A"," <font ;11>! ")
		var_Note.RelativePosition = 0.5
		var_Note.ShowLink = 0
		' var_Note.PartVOffset(1) = 0
		oG2antt.TemplateDef = "dim var_Note"
		oG2antt.TemplateDef = var_Note
		oG2antt.Template = "var_Note.PartVOffset(1) = 0"

		' var_Note.PartShadow(1) = .f.
		oG2antt.TemplateDef = "dim var_Note"
		oG2antt.TemplateDef = var_Note
		oG2antt.Template = "var_Note.PartShadow(1) = False"

		' var_Note.PartBackColor(1) = 65535
		oG2antt.TemplateDef = "dim var_Note"
		oG2antt.TemplateDef = var_Note
		oG2antt.Template = "var_Note.PartBackColor(1) = 65535"

oG2antt.EndUpdate()
|
|
1834
|
How do I highlight a bar with an icon, exclamation mark or some warning sign, without using exBarCaption, exBarExtraCaption which I've already use for something else ( sample 1 )
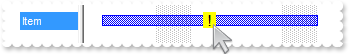
Dim h as N
Dim oG2antt as P
Dim var_Chart as P
Dim var_Items as P

oG2antt = topparent:CONTROL_ACTIVEX1.activex
oG2antt.BeginUpdate()
var_Chart = oG2antt.Chart
	var_Chart.FirstVisibleDate = {12/26/2000}
	' var_Chart.PaneWidth(.f.) = 128
	oG2antt.TemplateDef = "dim var_Chart"
	oG2antt.TemplateDef = var_Chart
	oG2antt.Template = "var_Chart.PaneWidth(False) = 128"

oG2antt.Columns.Add("Column")
var_Items = oG2antt.Items
	var_Items.AddItem("")
	h = var_Items.AddItem("Item")
	var_Items.AddItem("")
	var_Items.AddBar(h,"Task",{01/01/2001},{01/13/2001},"A")
	' var_Items.ItemBar(h,"A",53) = "[text=`<bgcolor=FFFF00><font ;11> ! `,align=0x11]"
	oG2antt.TemplateDef = "dim var_Items,h"
	oG2antt.TemplateDef = var_Items
	oG2antt.TemplateDef = h
	oG2antt.Template = "var_Items.ItemBar(h,`A`,53) = `[text=``<bgcolor=FFFF00><font ;11> ! ``,align=0x11]`"

	' var_Items.ItemBar(h,"A",55) = 8
	oG2antt.TemplateDef = "dim var_Items,h"
	oG2antt.TemplateDef = var_Items
	oG2antt.TemplateDef = h
	oG2antt.Template = "var_Items.ItemBar(h,`A`,55) = 8"

oG2antt.EndUpdate()
|
|
1833
|
How do I get the "Summary" bar being shown in the control's histogram (sample 2)
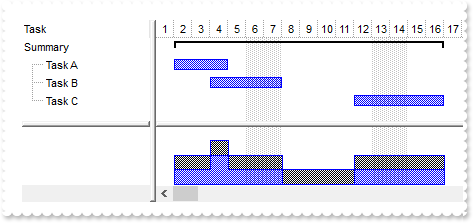
Dim hSummary as N
Dim hTask as N
Dim oG2antt as P
Dim var_Bar as P
Dim var_Chart as P
Dim var_Items as P

oG2antt = topparent:CONTROL_ACTIVEX1.activex
oG2antt.BeginUpdate()
oG2antt.Columns.Add("Task")
oG2antt.VisualAppearance.Add(1,"gBFLBCJwBAEHhEJAAEhABU0IQAAYAQGKQYhiAKBQAGaAoDDcMA4QwAAyjAKMEwsACEIrjKCRShyCYZRhGcTAJBMIhiGQYAChEZxVhEMgzDjIAxSJAcQRFESaAABGCQGh+N4/S4NIi0CIsZQjCaiZ7pKA5bgMCo+UrNMixZQVCSOGChYRpCaZWpGGodQRUFbVHAlKypJKCKrEWSrDhuYAAW7XM7yBS1TzVNSuLZtaLqSroAJ1WTWMB0Ra8NzZEKfaZACj4arKejrRDCMAggI=")
var_Chart = oG2antt.Chart
	' var_Chart.PaneWidth(.f.) = 128
	oG2antt.TemplateDef = "dim var_Chart"
	oG2antt.TemplateDef = var_Chart
	oG2antt.Template = "var_Chart.PaneWidth(False) = 128"

	var_Chart.FirstVisibleDate = {01/01/2001}
	var_Chart.HistogramVisible = .t.
	var_Chart.HistogramHeight = 64
	var_Chart.HistogramView = 1136 'exHistogramNoGrouping + exHistogramAllItems
	var_Bar = var_Chart.Bars.Item("Task")
		var_Bar.HistogramPattern = var_Bar.Pattern
		var_Bar.HistogramType = 256
		var_Bar.HistogramCumulativeOriginalColorBars = 1
var_Items = oG2antt.Items
	hSummary = var_Items.AddItem("Summary")
	var_Items.AddBar(hSummary,"Task",{01/02/2001},{01/02/2001},"")
	' var_Items.ItemBar(hSummary,"",33) = 16777216
	oG2antt.TemplateDef = "dim var_Items,hSummary"
	oG2antt.TemplateDef = var_Items
	oG2antt.TemplateDef = hSummary
	oG2antt.Template = "var_Items.ItemBar(hSummary,``,33) = 16777216"

	hTask = var_Items.InsertItem(hSummary,,"Task A")
	var_Items.AddBar(hTask,"Task",{01/02/2001},{01/05/2001},"K1")
	hTask = var_Items.InsertItem(hSummary,,"Task B")
	var_Items.AddBar(hTask,"Task",{01/04/2001},{01/08/2001},"K2")
	hTask = var_Items.InsertItem(hSummary,,"Task C")
	var_Items.AddBar(hTask,"Task",{01/12/2001},{01/17/2001},"K3")
	' var_Items.ExpandItem(hSummary) = .t.
	oG2antt.TemplateDef = "dim var_Items,hSummary"
	oG2antt.TemplateDef = var_Items
	oG2antt.TemplateDef = hSummary
	oG2antt.Template = "var_Items.ExpandItem(hSummary) = True"

	var_Items.DefineSummaryBars(hSummary,"",-1,"<*>")
oG2antt.EndUpdate()
|
|
1832
|
How do I get the "Summary" bar being shown in the control's histogram (sample 1)
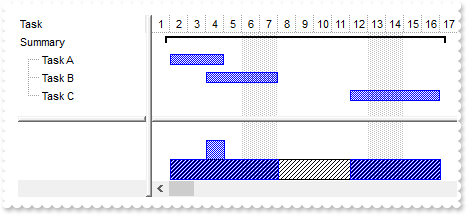
Dim hSummary as N
Dim hTask as N
Dim oG2antt as P
Dim var_Bar as P
Dim var_Bar1 as P
Dim var_Chart as P
Dim var_Items as P

oG2antt = topparent:CONTROL_ACTIVEX1.activex
oG2antt.BeginUpdate()
oG2antt.VisualAppearance.Add(1,"gBFLBCJwBAEHhEJAAEhABU0IQAAYAQGKQYhiAKBQAGaAoDDcMA4QwAAyjAKMEwsACEIrjKCRShyCYZRhGcTAJBMIhiGQYAChEZxVhEMgzDjIAxSJAcQRFESaAABGCQGh+N4/S4NIi0CIsZQjCaiZ7pKA5bgMCo+UrNMixZQVCSOGChYRpCaZWpGGodQRUFbVHAlKypJKCKrEWSrDhuYAAW7XM7yBS1TzVNSuLZtaLqSroAJ1WTWMB0Ra8NzZEKfaZACj4arKejrRDCMAggI=")
oG2antt.Columns.Add("Task")
var_Chart = oG2antt.Chart
	' var_Chart.PaneWidth(.f.) = 128
	oG2antt.TemplateDef = "dim var_Chart"
	oG2antt.TemplateDef = var_Chart
	oG2antt.Template = "var_Chart.PaneWidth(False) = 128"

	var_Chart.FirstVisibleDate = {01/01/2001}
	var_Chart.HistogramVisible = .t.
	var_Chart.HistogramHeight = 64
	var_Chart.HistogramView = 1136 'exHistogramNoGrouping + exHistogramAllItems
	var_Bar = var_Chart.Bars.Item("Task")
		var_Bar.HistogramPattern = var_Bar.Pattern
	var_Bar1 = var_Chart.Bars.Item("Summary")
		var_Bar1.Color = 16777216
		var_Bar1.HistogramColor = 65536
		var_Bar1.HistogramPattern = 6
var_Items = oG2antt.Items
	hSummary = var_Items.AddItem("Summary")
	var_Items.AddBar(hSummary,"Summary",{01/02/2001},{01/02/2001},"")
	hTask = var_Items.InsertItem(hSummary,,"Task A")
	var_Items.AddBar(hTask,"Task",{01/02/2001},{01/05/2001},"K1")
	hTask = var_Items.InsertItem(hSummary,,"Task B")
	var_Items.AddBar(hTask,"Task",{01/04/2001},{01/08/2001},"K2")
	hTask = var_Items.InsertItem(hSummary,,"Task C")
	var_Items.AddBar(hTask,"Task",{01/12/2001},{01/17/2001},"K3")
	' var_Items.ExpandItem(hSummary) = .t.
	oG2antt.TemplateDef = "dim var_Items,hSummary"
	oG2antt.TemplateDef = var_Items
	oG2antt.TemplateDef = hSummary
	oG2antt.Template = "var_Items.ExpandItem(hSummary) = True"

	var_Items.DefineSummaryBars(hSummary,"",-1,"<*>")
oG2antt.EndUpdate()
|
|
1831
|
How can I temporarily/programmatically hide the control's tooltip
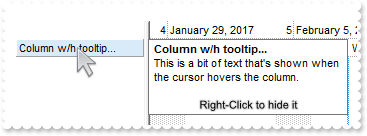
' Fired when right mouse button is clicked
function RClick as v ()
	Dim nToolTipDelay as
	oG2antt = topparent:CONTROL_ACTIVEX1.activex
	nToolTipDelay = oG2antt.ToolTipDelay
	oG2antt.ToolTipDelay = 0
	oG2antt.ToolTipDelay = nToolTipDelay
end function

Dim oG2antt as P
Dim var_Chart as P
Dim var_Column as local

oG2antt = topparent:CONTROL_ACTIVEX1.activex
oG2antt.BeginUpdate()
' oG2antt.Columns.Add("Column w/h tooltip...").ToolTip = "This is a bit of text that's shown when the cursor hovers the column.<br><br><sha ;;0><c>Right-Click to hide it</sha>"
var_Column = oG2antt.Columns.Add("Column w/h tooltip...")
oG2antt.TemplateDef = "dim var_Column"
oG2antt.TemplateDef = var_Column
oG2antt.Template = "var_Column.ToolTip = `This is a bit of text that's shown when the cursor hovers the column.<br><br><sha ;;0><c>Right-Click to hide it</sha>`"

var_Chart = oG2antt.Chart
	var_Chart.FirstWeekDay = var_Chart.LocFirstWeekDay
	var_Chart.MonthNames = var_Chart.LocMonthNames
	var_Chart.WeekDays = var_Chart.LocWeekDays
	var_Chart.AMPM = var_Chart.LocAMPM
	var_Chart.LevelCount = 2
	' var_Chart.PaneWidth(.f.) = 128
	oG2antt.TemplateDef = "dim var_Chart"
	oG2antt.TemplateDef = var_Chart
	oG2antt.Template = "var_Chart.PaneWidth(False) = 128"

	var_Chart.UnitScale = 4096
oG2antt.HeaderAppearance = 1
oG2antt.BackColorLevelHeader = oG2antt.BackColor
oG2antt.EndUpdate()
|
|
1830
|
Is it possible to find out the handle of the item, giving the key of the bar only
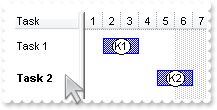
Dim oG2antt as P
Dim var_Chart as P
Dim var_Items as P

oG2antt = topparent:CONTROL_ACTIVEX1.activex
oG2antt.BeginUpdate()
oG2antt.Debug = .t.
oG2antt.DefaultItemHeight = 32
oG2antt.Columns.Add("Task")
var_Chart = oG2antt.Chart
	' var_Chart.PaneWidth(.f.) = 64
	oG2antt.TemplateDef = "dim var_Chart"
	oG2antt.TemplateDef = var_Chart
	oG2antt.Template = "var_Chart.PaneWidth(False) = 64"

	var_Chart.Bars.Item("Task").Height = 16
	var_Chart.FirstVisibleDate = {01/01/2001}
	var_Chart.ShowLinks = 1
var_Items = oG2antt.Items
	var_Items.AddBar(var_Items.AddItem("Task 1"),"Task",{01/02/2001},{01/04/2001},"K1")
	var_Items.AddBar(var_Items.AddItem("Task 2"),"Task",{01/05/2001},{01/07/2001},"K2")
	' var_Items.ItemBold(var_Items.ItemBar(0,"K2",512)) = .t.
	oG2antt.TemplateDef = "dim var_Items"
	oG2antt.TemplateDef = var_Items
	oG2antt.Template = "var_Items.ItemBold(ItemBar(0,`K2`,512)) = True"

oG2antt.EndUpdate()
|
|
1829
|
How can I programmatically add a link between two bars, knowing the keys of these bars only
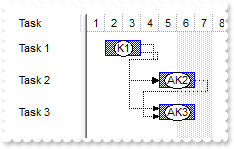
Dim h1 as N
Dim h2 as N
Dim h3 as N
Dim oG2antt as P
Dim var_Chart as P
Dim var_Items as P

oG2antt = topparent:CONTROL_ACTIVEX1.activex
oG2antt.BeginUpdate()
oG2antt.Debug = .t.
oG2antt.DefaultItemHeight = 32
oG2antt.Columns.Add("Task")
var_Chart = oG2antt.Chart
	' var_Chart.PaneWidth(.f.) = 64
	oG2antt.TemplateDef = "dim var_Chart"
	oG2antt.TemplateDef = var_Chart
	oG2antt.Template = "var_Chart.PaneWidth(False) = 64"

	var_Chart.Bars.Item("Task").Height = 16
	var_Chart.FirstVisibleDate = {01/01/2001}
	var_Chart.ShowLinks = 1
var_Items = oG2antt.Items
	h1 = var_Items.AddItem("Task 1")
	var_Items.AddBar(h1,"Task",{01/02/2001},{01/04/2001},"K1")
	h2 = var_Items.AddItem("Task 2")
	var_Items.AddBar(h2,"Task",{01/05/2001},{01/07/2001},"AK2")
	h3 = var_Items.AddItem("Task 3")
	var_Items.AddBar(h3,"Task",{01/05/2001},{01/07/2001},"AK3")
	var_Items.AddLink("Link1",0,"K1",0,"AK2")
	var_Items.AddLink("Link2",0,"K1",0,"<A?3>")
	var_Items.AddLink("Link3",0,"<*2>",0,"AK3")
oG2antt.EndUpdate()
|
|
1828
|
I'm trying to use automatic numbering of the outline. How can I have A, B, C for root items, 1, 2, 3 for the sub-items, and a, b, c for sub-sub-items (sample 3)
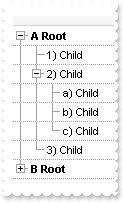
Dim h as N
Dim hChild as N
Dim oG2antt as P
Dim var_Column as P
Dim var_Columns as P
Dim var_Items as P

oG2antt = topparent:CONTROL_ACTIVEX1.activex
oG2antt.BeginUpdate()
oG2antt.LinesAtRoot = -1
oG2antt.DrawGridLines = -2
oG2antt.AutoDrag = 3
oG2antt.HasLines = 1
oG2antt.Indent = 16
oG2antt.MarkSearchColumn = .f.
var_Columns = oG2antt.Columns
	var_Column = var_Columns.Add("")
		' var_Column.Def(17) = 1
		oG2antt.TemplateDef = "dim var_Column"
		oG2antt.TemplateDef = var_Column
		oG2antt.Template = "var_Column.Def(17) = 1"

		var_Column.FormatColumn = "((1:=(0 :=(1 rpos '.|A-Z||a-z|')) rfind `.`) < 0 ? `<b>` + =:0 + `` :  (=:0 mid (1 + 1 + =:1) )  + `)` ) + ` ` + value"
var_Items = oG2antt.Items
	h = var_Items.AddItem("Root")
	var_Items.InsertItem(h,,"Child")
	hChild = var_Items.InsertItem(h,,"Child")
	var_Items.InsertItem(hChild,,"Child")
	var_Items.InsertItem(hChild,,"Child")
	var_Items.InsertItem(hChild,,"Child")
	var_Items.InsertItem(h,,"Child")
	' var_Items.ExpandItem(0) = .t.
	oG2antt.TemplateDef = "dim var_Items"
	oG2antt.TemplateDef = var_Items
	oG2antt.Template = "var_Items.ExpandItem(0) = True"

	h = var_Items.AddItem("Root")
	var_Items.InsertItem(h,,"Child")
	hChild = var_Items.InsertItem(h,,"Child")
	' var_Items.CellState(hChild,0) = 1
	oG2antt.TemplateDef = "dim var_Items,hChild"
	oG2antt.TemplateDef = var_Items
	oG2antt.TemplateDef = hChild
	oG2antt.Template = "var_Items.CellState(hChild,0) = 1"

	var_Items.InsertItem(hChild,,"Child")
	var_Items.InsertItem(hChild,,"Child")
	var_Items.InsertItem(hChild,,"Child")
	var_Items.InsertItem(h,,"Child")
oG2antt.EndUpdate()
|
|
1827
|
I'm trying to use automatic numbering of the outline. How can I have A, B, C for root items, 1, 2, 3 for the sub-items, and a, b, c for sub-sub-items (sample 2)
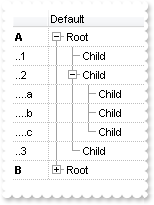
Dim h as N
Dim hChild as N
Dim oG2antt as P
Dim var_Column as P
Dim var_Columns as P
Dim var_Items as P

oG2antt = topparent:CONTROL_ACTIVEX1.activex
oG2antt.BeginUpdate()
oG2antt.LinesAtRoot = -1
oG2antt.GridLineColor = 12500670
oG2antt.DrawGridLines = -2
oG2antt.AutoDrag = 3
oG2antt.HasLines = 1
oG2antt.Indent = 16
var_Columns = oG2antt.Columns
	var_Columns.Add("Default")
	var_Column = var_Columns.Add("")
		' var_Column.Def(17) = 1
		oG2antt.TemplateDef = "dim var_Column"
		oG2antt.TemplateDef = var_Column
		oG2antt.Template = "var_Column.Def(17) = 1"

		' var_Column.Def(49) = 4
		oG2antt.TemplateDef = "dim var_Column"
		oG2antt.TemplateDef = var_Column
		oG2antt.Template = "var_Column.Def(49) = 4"

		var_Column.AllowSizing = .f.
		var_Column.Width = 36
		var_Column.Position = 0
		var_Column.FormatColumn = "(1:=(0 :=(1 rpos '.|A-Z||a-z|')) rfind `.`) < 0 ? `<b>` + =:0 : (`............` left 2 * (=:0 count `.`)) + (=:0 mid (1 + 1 + =:1) ) "
var_Items = oG2antt.Items
	h = var_Items.AddItem("Root")
	var_Items.InsertItem(h,,"Child")
	hChild = var_Items.InsertItem(h,,"Child")
	var_Items.InsertItem(hChild,,"Child")
	var_Items.InsertItem(hChild,,"Child")
	var_Items.InsertItem(hChild,,"Child")
	var_Items.InsertItem(h,,"Child")
	' var_Items.ExpandItem(0) = .t.
	oG2antt.TemplateDef = "dim var_Items"
	oG2antt.TemplateDef = var_Items
	oG2antt.Template = "var_Items.ExpandItem(0) = True"

	h = var_Items.AddItem("Root")
	var_Items.InsertItem(h,,"Child")
	hChild = var_Items.InsertItem(h,,"Child")
	' var_Items.CellState(hChild,0) = 1
	oG2antt.TemplateDef = "dim var_Items,hChild"
	oG2antt.TemplateDef = var_Items
	oG2antt.TemplateDef = hChild
	oG2antt.Template = "var_Items.CellState(hChild,0) = 1"

	var_Items.InsertItem(hChild,,"Child")
	var_Items.InsertItem(hChild,,"Child")
	var_Items.InsertItem(hChild,,"Child")
	var_Items.InsertItem(h,,"Child")
oG2antt.EndUpdate()
|
|
1826
|
I'm trying to use automatic numbering of the outline. How can I have A, B, C for root items, 1, 2, 3 for the sub-items, and a, b, c for sub-sub-items (sample 1)
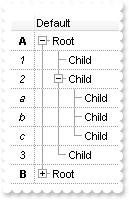
Dim h as N
Dim hChild as N
Dim oG2antt as P
Dim var_Column as P
Dim var_Columns as P
Dim var_Items as P

oG2antt = topparent:CONTROL_ACTIVEX1.activex
oG2antt.BeginUpdate()
oG2antt.LinesAtRoot = -1
oG2antt.DrawGridLines = -2
oG2antt.AutoDrag = 3
oG2antt.HasLines = 1
oG2antt.Indent = 16
var_Columns = oG2antt.Columns
	var_Columns.Add("Default")
	var_Column = var_Columns.Add("")
		' var_Column.Def(17) = 1
		oG2antt.TemplateDef = "dim var_Column"
		oG2antt.TemplateDef = var_Column
		oG2antt.Template = "var_Column.Def(17) = 1"

		' var_Column.Def(49) = 4
		oG2antt.TemplateDef = "dim var_Column"
		oG2antt.TemplateDef = var_Column
		oG2antt.Template = "var_Column.Def(49) = 4"

		var_Column.Alignment = 2
		var_Column.AllowSizing = .f.
		var_Column.Width = 24
		var_Column.Position = 0
		var_Column.FormatColumn = "(1:=(0 :=(1 rpos '.|A-Z||a-z|')) rfind `.`) < 0 ? `<b>` + =:0 : `<i>` + (=:0 mid (1 + 1 + =:1) ) "
var_Items = oG2antt.Items
	h = var_Items.AddItem("Root")
	var_Items.InsertItem(h,,"Child")
	hChild = var_Items.InsertItem(h,,"Child")
	var_Items.InsertItem(hChild,,"Child")
	var_Items.InsertItem(hChild,,"Child")
	var_Items.InsertItem(hChild,,"Child")
	var_Items.InsertItem(h,,"Child")
	' var_Items.ExpandItem(0) = .t.
	oG2antt.TemplateDef = "dim var_Items"
	oG2antt.TemplateDef = var_Items
	oG2antt.Template = "var_Items.ExpandItem(0) = True"

	h = var_Items.AddItem("Root")
	var_Items.InsertItem(h,,"Child")
	hChild = var_Items.InsertItem(h,,"Child")
	' var_Items.CellState(hChild,0) = 1
	oG2antt.TemplateDef = "dim var_Items,hChild"
	oG2antt.TemplateDef = var_Items
	oG2antt.TemplateDef = hChild
	oG2antt.Template = "var_Items.CellState(hChild,0) = 1"

	var_Items.InsertItem(hChild,,"Child")
	var_Items.InsertItem(hChild,,"Child")
	var_Items.InsertItem(hChild,,"Child")
	var_Items.InsertItem(h,,"Child")
oG2antt.EndUpdate()
|
|
1825
|
How can I programmatically group by columns, without having the control's sort bar visible
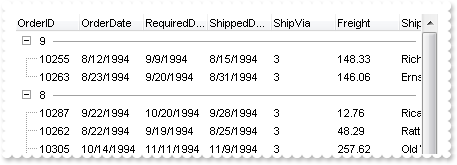
Dim oG2antt as P
Dim rs as P
Dim var_Chart as local

oG2antt = topparent:CONTROL_ACTIVEX1.activex
oG2antt.BeginUpdate()
' oG2antt.Chart.PaneWidth(.t.) = 0
var_Chart = oG2antt.Chart
oG2antt.TemplateDef = "dim var_Chart"
oG2antt.TemplateDef = var_Chart
oG2antt.Template = "var_Chart.PaneWidth(True) = 0"

oG2antt.ColumnAutoResize = .f.
rs = OLE.Create("ADOR.Recordset")
	rs.Open("Orders","Provider=Microsoft.ACE.OLEDB.12.0;Data Source=C:\Program Files\Exontrol\ExG2antt\Sample\Access\misc.accdb",3,3)
oG2antt.DataSource = rs
oG2antt.SortBarHeight = 0
oG2antt.SortBarVisible = .t.
oG2antt.SortBarCaption = "Drag a <b>column</b> header here to group by that column."
oG2antt.AllowGroupBy = .t.
oG2antt.Layout = "multiplesort=\"C1:2\""
oG2antt.EndUpdate()
|
|
1824
|
How do I perform my own sort
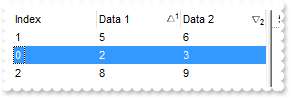
' Fired when the control sorts a column.
function Sort as v ()
	Dim var_Items as P
	oG2antt = topparent:CONTROL_ACTIVEX1.activex
	? "Sort"
	var_Items = oG2antt.Items
		' var_Items.ItemPosition(var_Items.ItemByIndex(1)) = 0
		oG2antt.TemplateDef = "dim var_Items"
		oG2antt.TemplateDef = var_Items
		oG2antt.Template = "var_Items.ItemPosition(ItemByIndex(1)) = 0"
		' var_Items.ItemPosition(var_Items.ItemByIndex(0)) = 1
		oG2antt.TemplateDef = "dim var_Items"
		oG2antt.TemplateDef = var_Items
		oG2antt.Template = "var_Items.ItemPosition(ItemByIndex(0)) = 1"

end function

Dim h as N
Dim oG2antt as P
Dim var_Column as local
Dim var_Columns as P
Dim var_Items as P

oG2antt = topparent:CONTROL_ACTIVEX1.activex
oG2antt.BeginUpdate()
oG2antt.SingleSort = .f.
oG2antt.SortOnClick = 1
var_Columns = oG2antt.Columns
	' var_Columns.Add("Index").FormatColumn = "0 index ``"
	var_Column = var_Columns.Add("Index")
	oG2antt.TemplateDef = "dim var_Column"
	oG2antt.TemplateDef = var_Column
	oG2antt.Template = "var_Column.FormatColumn = `0 index `````"

	var_Columns.Add("Data 1")
	var_Columns.Add("Data 2")
var_Items = oG2antt.Items
	h = var_Items.AddItem(0)
	' var_Items.CellValue(h,1) = 2
	oG2antt.TemplateDef = "dim var_Items,h"
	oG2antt.TemplateDef = var_Items
	oG2antt.TemplateDef = h
	oG2antt.Template = "var_Items.CellValue(h,1) = 2"

	' var_Items.CellValue(h,2) = 3
	oG2antt.TemplateDef = "dim var_Items,h"
	oG2antt.TemplateDef = var_Items
	oG2antt.TemplateDef = h
	oG2antt.Template = "var_Items.CellValue(h,2) = 3"

	h = var_Items.AddItem(4)
	' var_Items.CellValue(h,1) = 5
	oG2antt.TemplateDef = "dim var_Items,h"
	oG2antt.TemplateDef = var_Items
	oG2antt.TemplateDef = h
	oG2antt.Template = "var_Items.CellValue(h,1) = 5"

	' var_Items.CellValue(h,2) = 6
	oG2antt.TemplateDef = "dim var_Items,h"
	oG2antt.TemplateDef = var_Items
	oG2antt.TemplateDef = h
	oG2antt.Template = "var_Items.CellValue(h,2) = 6"

	h = var_Items.AddItem(7)
	' var_Items.CellValue(h,1) = 8
	oG2antt.TemplateDef = "dim var_Items,h"
	oG2antt.TemplateDef = var_Items
	oG2antt.TemplateDef = h
	oG2antt.Template = "var_Items.CellValue(h,1) = 8"

	' var_Items.CellValue(h,2) = 9
	oG2antt.TemplateDef = "dim var_Items,h"
	oG2antt.TemplateDef = var_Items
	oG2antt.TemplateDef = h
	oG2antt.Template = "var_Items.CellValue(h,2) = 9"

oG2antt.Layout = "multiplesort=\"C1:1 C2:2\""
oG2antt.EndUpdate()
|
|
1823
|
Is it possible to have a different alignment for parts of the cell's caption
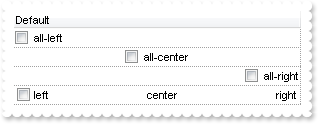
Dim h as N
Dim oG2antt as P
Dim var_Chart as local
Dim var_Column as P
Dim var_Items as P

oG2antt = topparent:CONTROL_ACTIVEX1.activex
oG2antt.BeginUpdate()
' oG2antt.Chart.PaneWidth(.t.) = .t.
var_Chart = oG2antt.Chart
oG2antt.TemplateDef = "dim var_Chart"
oG2antt.TemplateDef = var_Chart
oG2antt.Template = "var_Chart.PaneWidth(True) = True"

oG2antt.TreeColumnIndex = -1
oG2antt.DrawGridLines = -2
var_Column = oG2antt.Columns.Add("Default")
	' var_Column.Def(0) = .t.
	oG2antt.TemplateDef = "dim var_Column"
	oG2antt.TemplateDef = var_Column
	oG2antt.Template = "var_Column.Def(0) = True"

var_Items = oG2antt.Items
	' var_Items.CellHAlignment(var_Items.AddItem("all-left"),0) = 0
	oG2antt.TemplateDef = "dim var_Items"
	oG2antt.TemplateDef = var_Items
	oG2antt.Template = "var_Items.CellHAlignment(AddItem(`all-left`),0) = 0"

	' var_Items.CellHAlignment(var_Items.AddItem("all-center"),0) = 1
	oG2antt.TemplateDef = "dim var_Items"
	oG2antt.TemplateDef = var_Items
	oG2antt.Template = "var_Items.CellHAlignment(AddItem(`all-center`),0) = 1"

	' var_Items.CellHAlignment(var_Items.AddItem("all-right"),0) = 2
	oG2antt.TemplateDef = "dim var_Items"
	oG2antt.TemplateDef = var_Items
	oG2antt.Template = "var_Items.CellHAlignment(AddItem(`all-right`),0) = 2"

	h = var_Items.AddItem("left<c>center<r>right")
	' var_Items.CellValueFormat(h,0) = 1
	oG2antt.TemplateDef = "dim var_Items,h"
	oG2antt.TemplateDef = var_Items
	oG2antt.TemplateDef = h
	oG2antt.Template = "var_Items.CellValueFormat(h,0) = 1"

oG2antt.EndUpdate()
|
|
1822
|
I have a column with Def(exCellSingleLine) property on False, word-wrapping, and I am wondering if possible to update the column's content while user is resizing it
Dim oG2antt as P
Dim var_Chart as local
Dim var_Column as P
Dim var_Column1 as P
Dim var_Columns as P
Dim var_Items as P

oG2antt = topparent:CONTROL_ACTIVEX1.activex
oG2antt.BeginUpdate()
' oG2antt.Chart.PaneWidth(.t.) = 0
var_Chart = oG2antt.Chart
oG2antt.TemplateDef = "dim var_Chart"
oG2antt.TemplateDef = var_Chart
oG2antt.Template = "var_Chart.PaneWidth(True) = 0"

var_Columns = oG2antt.Columns
	var_Column = var_Columns.Add("MultipleLine")
		var_Column.Width = 32
		' var_Column.Def(16) = .f.
		oG2antt.TemplateDef = "dim var_Column"
		oG2antt.TemplateDef = var_Column
		oG2antt.Template = "var_Column.Def(16) = False"

		' var_Column.Def(64) = .t.
		oG2antt.TemplateDef = "dim var_Column"
		oG2antt.TemplateDef = var_Column
		oG2antt.Template = "var_Column.Def(64) = True"

	var_Column1 = var_Columns.Add("SingleLine")
		' var_Column1.Def(16) = .f.
		oG2antt.TemplateDef = "dim var_Column1"
		oG2antt.TemplateDef = var_Column1
		oG2antt.Template = "var_Column1.Def(16) = False"

var_Items = oG2antt.Items
	' var_Items.CellValue(var_Items.AddItem("This is a bit of long text that should break the line"),1) = "This is a bit of long text that should break the line"
	oG2antt.TemplateDef = "dim var_Items"
	oG2antt.TemplateDef = var_Items
	oG2antt.Template = "var_Items.CellValue(AddItem(`This is a bit of long text that should break the line`),1) = `This is a bit of long text that should break the line`"

oG2antt.EndUpdate()
|
|
1821
|
Is there an other way to detect if a bar is overlapping any other bar
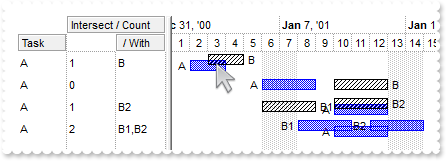
' Occurs when a bar is moving or resizing.
function BarResizing as v (Item  as  OLE::Exontrol.G2antt.1::HITEM, Key  as  A)
	oG2antt = topparent:CONTROL_ACTIVEX1.activex
	oG2antt.Refresh()
end function

Dim h as N
Dim oG2antt as P
Dim var_Bar as P
Dim var_Bar1 as P
Dim var_Chart as P
Dim var_Column as P
Dim var_Column1 as P
Dim var_Items as P

oG2antt = topparent:CONTROL_ACTIVEX1.activex
oG2antt.BeginUpdate()
oG2antt.DrawGridLines = 2
oG2antt.HeaderAppearance = 4
oG2antt.BackColorLevelHeader = oG2antt.BackColor
oG2antt.DefaultItemHeight = 22
oG2antt.Columns.Add("Task")
var_Column = oG2antt.Columns.Add("Intersect / Count")
	' var_Column.Def(19) = "A"
	oG2antt.TemplateDef = "dim var_Column"
	oG2antt.TemplateDef = var_Column
	oG2antt.Template = "var_Column.Def(19) = `A`"

	' var_Column.Def(18) = 521
	oG2antt.TemplateDef = "dim var_Column"
	oG2antt.TemplateDef = var_Column
	oG2antt.Template = "var_Column.Def(18) = 521"

	var_Column.LevelKey = 1
var_Column1 = oG2antt.Columns.Add(" / With")
	' var_Column1.Def(19) = "A"
	oG2antt.TemplateDef = "dim var_Column1"
	oG2antt.TemplateDef = var_Column1
	oG2antt.Template = "var_Column1.Def(19) = `A`"

	' var_Column1.Def(18) = 520
	oG2antt.TemplateDef = "dim var_Column1"
	oG2antt.TemplateDef = var_Column1
	oG2antt.Template = "var_Column1.Def(18) = 520"

	var_Column1.LevelKey = 1
oG2antt.Items.AllowCellValueToItemBar = .t.
var_Chart = oG2antt.Chart
	var_Chart.LevelCount = 2
	' var_Chart.PaneWidth(.f.) = 148
	oG2antt.TemplateDef = "dim var_Chart"
	oG2antt.TemplateDef = var_Chart
	oG2antt.Template = "var_Chart.PaneWidth(False) = 148"

	var_Chart.FirstVisibleDate = {01/01/2001}
	var_Bar = var_Chart.Bars.Item("Task")
		var_Bar.OverlaidType = 1
		var_Bar.OverlaidGroup = "TaskB"
		' var_Bar.Def(4) = 16
		oG2antt.TemplateDef = "dim var_Bar"
		oG2antt.TemplateDef = var_Bar
		oG2antt.Template = "var_Bar.Def(4) = 16"

	var_Bar1 = var_Chart.Bars.Add("TaskB")
		var_Bar1.Pattern = 6
		' var_Bar1.Def(4) = 18
		oG2antt.TemplateDef = "dim var_Bar1"
		oG2antt.TemplateDef = var_Bar1
		oG2antt.Template = "var_Bar1.Def(4) = 18"

var_Items = oG2antt.Items
	h = var_Items.AddItem("A")
	var_Items.AddBar(h,"Task",{01/02/2001},{01/04/2001},"A","A")
	var_Items.AddBar(h,"TaskB",{01/03/2001},{01/05/2001},"B","B")
	h = var_Items.AddItem("A")
	var_Items.AddBar(h,"Task",{01/06/2001},{01/09/2001},"A","A")
	var_Items.AddBar(h,"TaskB",{01/10/2001},{01/13/2001},"B","B")
	h = var_Items.AddItem("A")
	var_Items.AddBar(h,"TaskB",{01/06/2001},{01/09/2001},"B1","B1")
	var_Items.AddBar(h,"Task",{01/10/2001},{01/13/2001},"A","A")
	var_Items.AddBar(h,"TaskB",{01/10/2001},{01/13/2001},"B2","B2")
	h = var_Items.AddItem("A")
	var_Items.AddBar(h,"Task",{01/08/2001},{01/11/2001},"B1","B1")
	var_Items.AddBar(h,"Task",{01/10/2001},{01/13/2001},"A","A")
	var_Items.AddBar(h,"Task",{01/12/2001},{01/15/2001},"B2","B2")
oG2antt.EndUpdate()
|
|
1820
|
How can I get the absolute position of an item
' Occurs after a new Item has been inserted to Items collection.
function AddItem as v (Item  as  OLE::Exontrol.G2antt.1::HITEM)
	Dim var_Items as P
	oG2antt = topparent:CONTROL_ACTIVEX1.activex
	var_Items = oG2antt.Items
		var_Items.AddBar(Item,"Task",{01/02/2017},{01/05/2017})
end function

' Occurs when the user moves the mouse.
function MouseMove as v (Button  as  N, Shift  as  N, X  as  OLE::Exontrol.G2antt.1::OLE_XPOS_PIXELS, Y  as  OLE::Exontrol.G2antt.1::OLE_YPOS_PIXELS)
	Dim var_Items as P
	oG2antt = topparent:CONTROL_ACTIVEX1.activex
	var_Items = oG2antt.Items
		? var_Items.CellCaption(oG2antt.ItemFromPoint(-1,-1,c,hit),"Position")
end function

Dim h as N
Dim oG2antt as P
Dim var_Chart as P
Dim var_Column as local
Dim var_Column1 as P
Dim var_Items as P

oG2antt = topparent:CONTROL_ACTIVEX1.activex
oG2antt.BeginUpdate()
var_Chart = oG2antt.Chart
	var_Chart.LevelCount = 2
	var_Chart.FirstVisibleDate = {01/01/2017}
oG2antt.BackColorLevelHeader = oG2antt.BackColor
oG2antt.BackColorAlternate = 15790320
oG2antt.LinesAtRoot = -1
' oG2antt.Columns.Add("Def").DisplayFilterButton = .t.
var_Column = oG2antt.Columns.Add("Def")
oG2antt.TemplateDef = "dim var_Column"
oG2antt.TemplateDef = var_Column
oG2antt.Template = "var_Column.DisplayFilterButton = True"

var_Items = oG2antt.Items
	h = var_Items.AddItem("Root")
	var_Items.InsertItem(var_Items.InsertItem(h,,"Child 1"),,"Sub-Child 1")
	var_Items.InsertItem(var_Items.InsertItem(h,,"Child 2"),,"Sub-Child 2")
oG2antt.PutItems(oG2antt.GetItems(-1))
oG2antt.PutItems(oG2antt.GetItems(-1))
oG2antt.PutItems(oG2antt.GetItems(-1))
var_Column1 = oG2antt.Columns.Add("Position")
	var_Column1.FormatColumn = "1 apos ``"
	var_Column1.Visible = .f.
oG2antt.EndUpdate()
|
|
1819
|
How do I sort the index column as numeric (Method 2)
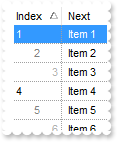
' Occurs after a new Item has been inserted to Items collection.
function AddItem as v (Item  as  OLE::Exontrol.G2antt.1::HITEM)
	Dim var_Items as P
	oG2antt = topparent:CONTROL_ACTIVEX1.activex
	var_Items = oG2antt.Items
		' var_Items.CellData(Item,1) = var_Items.CellCaption(Item,1)
		oG2antt.TemplateDef = "dim var_Items,Item"
		oG2antt.TemplateDef = var_Items
		oG2antt.TemplateDef = Item
		oG2antt.Template = "var_Items.CellData(Item,1) = CellCaption(Item,1)"

end function

Dim oG2antt as P
Dim var_Column as P
Dim var_Column1 as P
Dim var_Items as P

oG2antt = topparent:CONTROL_ACTIVEX1.activex
oG2antt.BeginUpdate()
oG2antt.DrawGridLines = -1
oG2antt.ColumnAutoResize = .t.
oG2antt.ShowFocusRect = .f.
var_Column = oG2antt.Columns.Add("Next")
	' var_Column.Def(48) = 4
	oG2antt.TemplateDef = "dim var_Column"
	oG2antt.TemplateDef = var_Column
	oG2antt.Template = "var_Column.Def(48) = 4"

	' var_Column.Def(52) = 4
	oG2antt.TemplateDef = "dim var_Column"
	oG2antt.TemplateDef = var_Column
	oG2antt.Template = "var_Column.Def(52) = 4"

var_Column1 = oG2antt.Columns.Add("Index")
	var_Column1.AllowSizing = .f.
	var_Column1.Width = 48
	var_Column1.FormatColumn = "(((0 := (1 index ``)) mod 3) case ( default: ``; 0 : `<r><fgcolor=B0B0B0>`; 1: ``; 2 : `<c><fgcolor=808080>` )) + str(=:0)"
	' var_Column1.Def(17) = 1
	oG2antt.TemplateDef = "dim var_Column1"
	oG2antt.TemplateDef = var_Column1
	oG2antt.Template = "var_Column1.Def(17) = 1"

	var_Column1.SortType = 5
	var_Column1.Position = 0
var_Items = oG2antt.Items
	var_Items.AddItem("Item 1")
	var_Items.AddItem("Item 2")
	var_Items.AddItem("Item 3")
	var_Items.AddItem("Item 4")
	var_Items.AddItem("Item 5")
	var_Items.AddItem("Item 6")
	var_Items.AddItem("Item 7")
	var_Items.AddItem("Item 8")
	var_Items.AddItem("Item 9")
	var_Items.AddItem("Item 10")
oG2antt.EndUpdate()
|
|
1818
|
How do I sort the index column as numeric (Method 1)
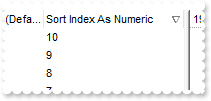
Dim oG2antt as P
Dim var_Column as P
Dim var_Column1 as P
Dim var_Items as P

oG2antt = topparent:CONTROL_ACTIVEX1.activex
oG2antt.BeginUpdate()
var_Column = oG2antt.Columns.Add("Sort Index As String (Default)")
	var_Column.FormatColumn = "1 index ``"
var_Column1 = oG2antt.Columns.Add("Sort Index As Numeric")
	var_Column1.ComputedField = "%C0"
	var_Column1.SortType = 1
var_Items = oG2antt.Items
	var_Items.AddItem("")
	var_Items.AddItem("")
	var_Items.AddItem("")
	var_Items.AddItem("")
	var_Items.AddItem("")
	var_Items.AddItem("")
	var_Items.AddItem("")
	var_Items.AddItem("")
	var_Items.AddItem("")
	var_Items.AddItem("")
oG2antt.EndUpdate()
|
|
1817
|
How can I put icons/images into buttons
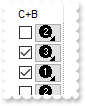
Dim oG2antt as P
Dim var_Column as P
Dim var_Items as P

oG2antt = topparent:CONTROL_ACTIVEX1.activex
oG2antt.BeginUpdate()
oG2antt.ColumnAutoResize = .t.
oG2antt.Images("gBJJgBAIDAAGAAEAAQhYAf8Pf4hh0QihCJo2AEZjQAjEZFEaIEaEEaAIAkcbk0olUrlktl0vmExmUzmk1m03nE5nU7nk9n0/oFBoVDolFo1HpFJpVLplNp1PqFRqVTqlVq1XrFZrVbrldr1fsFhsVjslls1ntFptVrtltt1vuFxuVzul1u13vF5vV7vl9v1/wGBwWDwmFw2HxGJxWLxmNx0xiFdyOTh8Tf9ZymXx+QytcyNgz8r0OblWjyWds+m0ka1Vf1ta1+r1mos2xrG2xeZ0+a0W0qOx3GO4NV3WeyvD2XJ5XL5nN51aiw+lfSj0gkUkAEllHanHI5j/cHg8EZf7w8vl8j4f/qfEZeB09/vjLAB30+kZQAP/P5/H6/yNAOAEAwCjMBwFAEDwJBMDwLBYAP2/8Hv8/gAGAD8LQs9w/nhDY/oygIA=")
var_Column = oG2antt.Columns.Add("C+B")
	var_Column.AllowSizing = .f.
	var_Column.Width = 48
	var_Column.FormatColumn = "` <img>` + ( 1 + (1 index ``) mod 3 ) + `</img> `"
	' var_Column.Def(17) = 1
	oG2antt.TemplateDef = "dim var_Column"
	oG2antt.TemplateDef = var_Column
	oG2antt.Template = "var_Column.Def(17) = 1"

	' var_Column.Def(0) = .t.
	oG2antt.TemplateDef = "dim var_Column"
	oG2antt.TemplateDef = var_Column
	oG2antt.Template = "var_Column.Def(0) = True"

	' var_Column.Def(2) = .t.
	oG2antt.TemplateDef = "dim var_Column"
	oG2antt.TemplateDef = var_Column
	oG2antt.Template = "var_Column.Def(2) = True"

	' var_Column.Def(3) = .t.
	oG2antt.TemplateDef = "dim var_Column"
	oG2antt.TemplateDef = var_Column
	oG2antt.Template = "var_Column.Def(3) = True"

oG2antt.Columns.Add("")
oG2antt.DrawGridLines = 2
oG2antt.DefaultItemHeight = 20
var_Items = oG2antt.Items
	var_Items.AddItem("")
	var_Items.AddItem("")
	var_Items.AddItem("")
	var_Items.AddItem("")
	var_Items.AddItem("")
	var_Items.AddItem("")
	var_Items.AddItem("")
	var_Items.AddItem("")
oG2antt.EndUpdate()
|
|
1816
|
Is it possible to have a CheckBox and Button TOGETHER on all cells in a column
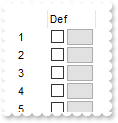
' Occurs when user clicks on the cell's button.
function ButtonClick as v (Item  as  OLE::Exontrol.G2antt.1::HITEM, ColIndex  as  N, Key  as  A)
	oG2antt = topparent:CONTROL_ACTIVEX1.activex
	? "ButtonClick"
	? Item
	? Key
end function

' Fired after cell's state has been changed.
function CellStateChanged as v (Item  as  OLE::Exontrol.G2antt.1::HITEM, ColIndex  as  N)
	oG2antt = topparent:CONTROL_ACTIVEX1.activex
	? "CellStateChanged"
	? Item
end function

Dim oG2antt as P
Dim var_Column as P
Dim var_Column1 as P
Dim var_Items as P

oG2antt = topparent:CONTROL_ACTIVEX1.activex
oG2antt.BeginUpdate()
oG2antt.ColumnAutoResize = .t.
var_Column = oG2antt.Columns.Add("")
	var_Column.AllowSizing = .f.
	var_Column.Width = 32
	var_Column.FormatColumn = "1 index ``"
var_Column1 = oG2antt.Columns.Add("Def")
	var_Column1.AllowSizing = .f.
	var_Column1.Width = 48
	var_Column1.FormatColumn = "`     `"
	' var_Column1.Def(0) = .t.
	oG2antt.TemplateDef = "dim var_Column1"
	oG2antt.TemplateDef = var_Column1
	oG2antt.Template = "var_Column1.Def(0) = True"

	' var_Column1.Def(2) = .t.
	oG2antt.TemplateDef = "dim var_Column1"
	oG2antt.TemplateDef = var_Column1
	oG2antt.Template = "var_Column1.Def(2) = True"

	' var_Column1.Def(3) = .t.
	oG2antt.TemplateDef = "dim var_Column1"
	oG2antt.TemplateDef = var_Column1
	oG2antt.Template = "var_Column1.Def(3) = True"

oG2antt.Columns.Add("")
var_Items = oG2antt.Items
	var_Items.AddItem("")
	var_Items.AddItem("")
	var_Items.AddItem("")
	var_Items.AddItem("")
	var_Items.AddItem("")
	var_Items.AddItem("")
	var_Items.AddItem("")
	var_Items.AddItem("")
oG2antt.EndUpdate()
|
|
1815
|
Does filtering work with umlauts / accents characters
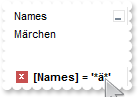
Dim oG2antt as P
Dim var_Chart as local
Dim var_Column as P
Dim var_Items as P
oG2antt = topparent:CONTROL_ACTIVEX1.activex
oG2antt.BeginUpdate()
' oG2antt.Chart.PaneWidth(.t.) = 0
var_Chart = oG2antt.Chart
oG2antt.TemplateDef = "dim var_Chart"
oG2antt.TemplateDef = var_Chart
oG2antt.Template = "var_Chart.PaneWidth(True) = 0"
var_Column = oG2antt.Columns.Add("Names")
var_Column.DisplayFilterButton = .t.
var_Column.FilterType = 3
var_Items = oG2antt.Items
var_Items.AddItem("Mantel")
var_Items.AddItem("Mechanik")
var_Items.AddItem("Motor")
var_Items.AddItem("Murks")
var_Items.AddItem("M�rchen")
var_Items.AddItem("M�hren")
var_Items.AddItem("M�hle")
var_Items.AddItem("S�rigraphie")
oG2antt.Columns.Item(0).Filter = "*�*"
oG2antt.ApplyFilter()
oG2antt.EndUpdate()
|
|
1814
|
How can I temporarily disable resizing the overview part of the control
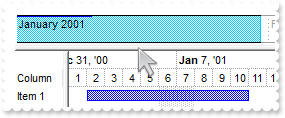
Dim oG2antt as P
Dim var_Chart as P
Dim var_Items as P

oG2antt = topparent:CONTROL_ACTIVEX1.activex
oG2antt.BeginUpdate()
oG2antt.BackColorLevelHeader = oG2antt.BackColor
oG2antt.OnResizeControl = 1024
var_Chart = oG2antt.Chart
	var_Chart.LevelCount = 2
	var_Chart.FirstVisibleDate = {01/01/2001}
	' var_Chart.PaneWidth(.f.) = 48
	oG2antt.TemplateDef = "dim var_Chart"
	oG2antt.TemplateDef = var_Chart
	oG2antt.Template = "var_Chart.PaneWidth(False) = 48"

	var_Chart.OverviewVisible = 69890 'exOverviewSplitter + exOverviewShowDateTimeScale + exOverviewAllowVerticalScroll + exOverviewShowAllVisible
	var_Chart.OverviewHeight = 32
oG2antt.Columns.Add("Column")
var_Items = oG2antt.Items
	var_Items.AddBar(var_Items.AddItem("Item 1"),"Task",{01/02/2001},{01/11/2001})
	var_Items.AddBar(var_Items.AddItem("Item 2"),"Task",{02/02/2001},{02/11/2001})
	var_Items.AddBar(var_Items.AddItem("Item 3"),"Task",{03/02/2001},{03/11/2001})
oG2antt.EndUpdate()
|
|
1813
|
Is it possible to resize the overview part of the control at runtime
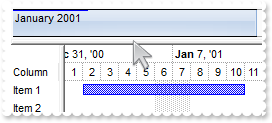
Dim oG2antt as P
Dim var_Chart as P
Dim var_Items as P

oG2antt = topparent:CONTROL_ACTIVEX1.activex
oG2antt.BeginUpdate()
oG2antt.VisualAppearance.Add(1,"gBFLBCJwBAEHhEJAAEhABVADg6AADACAxSDEMQBQKAAzQFAYbhgHCGAAGUYBRgmFgAQhFcZQSBcEgTDaMYzgMBYJhEMQyDSAUIjPEyMg0DjIIwgJIUaw0GSXIRkGQZChGJooTJQMrTZIEbQxHSkIyRVTmZACS5NRZPYy0FAkQhlFSbJBCOKwVomR5KUxTVg1DJwahLCKULLhGI7KgObIRSJOcZ1XAdCQ0cB0XpAC6LaqSA4nSjKcqwJKEZRJIyjJwgSrrWhePoJYBVAAQPQdDYaCivK5uWK6PqKUIlZBQGQVNS1MRrLSEcwgPKgAyzDadZzfQAWTZFTQjN61RgtXR6eyoAJ0aziFDVFo0WRlEwacorGhcbgPPrCRrxGBVNwgGOJo4kIeASB0Zw/iGDoym6dobh2XpiDWJo5HMd56h6dxjlICIEhQDQmDOIZUmQZZlAADpYHIEQ3nUGgNhCEIhAkawamAAAYEWRAGB2bA2EqYg2AyA4glgPgSgQYRIEIFoEmEeBWBiBphFAAgPDwDgDEycQ4A0Q5IwkDwjgyWA8k4SIsmUNoPEOFJbD0DhjHINA3E8Q4eDiDojhiYJmg+Ixokic4LmKQxiCkNk2CCX4DmGaA0nAN4NBiDJSDwTgTEycg4E0WIYlcPJiiiMJZhCTYpgCcw5g2OYOGWGQmCkEJkheYopGoVw1GSGQuA2ExIlOQJcDOZJzEDSJNBiAgiU4Q5GCeChNHkHJygsaBzGaCYimiCY0mMNZoCMWhUDUJ5pkYTIDk6YxwkwO5NlMOoch6JQJm4U4JCIMxWFSKbCBoKIgmJDAuDgKhohKIoTk0GhaHOJgNiMKJuDaaYzHCTYnAyaZmjSKIiDiCghjEYg6AaR4yk0OpOiFSQLAKNgjGcQ40lkMhOmqZo7DKTpzG6Pw3CmYx2HiNAsCqBh8h6Z5bh6T4oC0G4Im+OAtlMNpTjUTYDCKVo2C3QBLi6a5bH6YY4EyehzAGO4wEwDoejwK5rnK95vDgPJsDWTBjjSWAxnEK5aleNhriuawKi8Lp7H8HpHHGXBskyQpxguXwNgMTpDFiRZDnEExfBSPRvHuXwYkycYslae5NjMQwrDGNZxFyHINDsDRTBMKZKnKLIwm2S4xF0Jw8lKTIcm9eA0hyQwuksM5jiyVQwnQDQIlaVo0EyLwQlGcRNCME5EjKfYXGSWEhDMQ5QnOahHG6KwoFOCoFiOaBNlcdIjiQag7HOL0dwuxKC1aeNQI4BQihNDoEwXowxmh8CIL8Yg8ROBfASMcaIOR6CHBkMgLgrwUjLHkHMG4NQaBzE4MQaIyw5gxEsH0Dw9FBBNA6PUDoLwpjTHqF0N4WQShSHgGwcY2RkhdFCL8bYdwOivDqNse4fRnh5G+PYEgaR1B0E4B4D4ixxB4G8E8SI5R8D+DeJUc4eRPB/EaJ8DwpwojDHUPofwtxYjtH2F4d4sx3j7E+AcXo8B9geFCNYOIHhfg/GmPQPoXw3jZHuPoX4hxuj1H8J8T43RPhDEgM8eo/B/iQGuPwfxEh1guAIAwQAgCAg")
oG2antt.BackColorLevelHeader = oG2antt.BackColor
var_Chart = oG2antt.Chart
	var_Chart.LevelCount = 2
	var_Chart.FirstVisibleDate = {01/01/2001}
	' var_Chart.PaneWidth(.f.) = 48
	oG2antt.TemplateDef = "dim var_Chart"
	oG2antt.TemplateDef = var_Chart
	oG2antt.Template = "var_Chart.PaneWidth(False) = 48"

	var_Chart.OverviewVisible = 69890 'exOverviewSplitter + exOverviewShowDateTimeScale + exOverviewAllowVerticalScroll + exOverviewShowAllVisible
	var_Chart.OverviewHeight = 32
	var_Chart.OverviewSelBackColor = 16777216
	var_Chart.OverviewBackColor = 16448250
oG2antt.Columns.Add("Column")
var_Items = oG2antt.Items
	var_Items.AddBar(var_Items.AddItem("Item 1"),"Task",{01/02/2001},{01/11/2001})
	var_Items.AddBar(var_Items.AddItem("Item 2"),"Task",{02/02/2001},{02/11/2001})
	var_Items.AddBar(var_Items.AddItem("Item 3"),"Task",{03/02/2001},{03/11/2001})
oG2antt.EndUpdate()
|
|
1812
|
You've provided examples of how to create bars for each record of a MS Access table, however I would like to create a database connected Gantt that has multiple bars per item/resource. Could you please advise
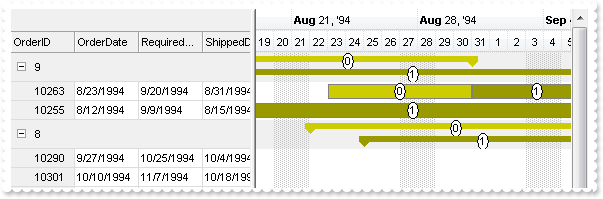
' Occurs after a new Group Item has been inserted to Items collection.
function AddGroupItem as v (Item  as  OLE::Exontrol.G2antt.1::HITEM)
	Dim var_Chart as local
	Dim var_Items as P
	oG2antt = topparent:CONTROL_ACTIVEX1.activex
	var_Items = oG2antt.Items
		var_Items.AddBar(Item,"Summary",var_Items.CellValue(Item,2),var_Items.CellValue(Item,4),"0")
		var_Items.DefineSummaryBars(Item,"0",-3,"0")
		var_Items.AddBar(Item,"SummaryB",var_Items.CellValue(Item,2),var_Items.CellValue(Item,4),"1")
		var_Items.DefineSummaryBars(Item,"1",-3,"1")
		' var_Items.ItemBackColor(Item) = 15790320
		oG2antt.TemplateDef = "dim var_Items,Item"
		oG2antt.TemplateDef = var_Items
		oG2antt.TemplateDef = Item
		oG2antt.Template = "var_Items.ItemBackColor(Item) = 15790320"
	' oG2antt.Chart.ItemBackColor(Item) = 15790320
	var_Chart = oG2antt.Chart
	oG2antt.TemplateDef = "dim var_Chart"
	oG2antt.TemplateDef = var_Chart
	oG2antt.Template = "var_Chart.ItemBackColor(Item) = 15790320"

end function

' Occurs after a new Item has been inserted to Items collection.
function AddItem as v (Item  as  OLE::Exontrol.G2antt.1::HITEM)
	Dim var_Items as P
	oG2antt = topparent:CONTROL_ACTIVEX1.activex
	var_Items = oG2antt.Items
		var_Items.AddBar(Item,"Task",var_Items.CellValue(Item,2),var_Items.CellValue(Item,4),var_Items.ItemBar(Item,"",256))
		var_Items.AddBar(Item,"TaskB",var_Items.CellValue(Item,3),var_Items.CellValue(Item,4),var_Items.ItemBar(Item,"",256))
end function

' Occurs when the user presses a mouse button.
function MouseDown as v (Button  as  N, Shift  as  N, X  as  OLE::Exontrol.G2antt.1::OLE_XPOS_PIXELS, Y  as  OLE::Exontrol.G2antt.1::OLE_YPOS_PIXELS)
	' FullRowSelect = Columns(c).Data
	Dim i as N
	oG2antt = topparent:CONTROL_ACTIVEX1.activex
	i = oG2antt.ItemFromPoint(-1,-1,c,hit)
end function

Dim oG2antt as P
Dim rs as P
Dim var_Bar as P
Dim var_Bar1 as P
Dim var_Bar2 as P
Dim var_Bar3 as P
Dim var_Chart as P

oG2antt = topparent:CONTROL_ACTIVEX1.activex
oG2antt.BeginUpdate()
oG2antt.ScrollBySingleLine = .t.
oG2antt.HeaderHeight = 22
oG2antt.HeaderAppearance = 1
oG2antt.BackColorLock = 15790320
oG2antt.BackColorHeader = oG2antt.BackColorLock
oG2antt.HasLines = 0
oG2antt.ColumnAutoResize = .f.
oG2antt.SortBarVisible = .f.
oG2antt.AllowGroupBy = .t.
oG2antt.ReadOnly = -1
oG2antt.ShowFocusRect = .f.
oG2antt.CountLockedColumns = 1
oG2antt.AutoDrag = 16
oG2antt.SingleSort = .f.
oG2antt.ColumnsAllowSizing = .t.
oG2antt.DrawGridLines = -1
oG2antt.GridLineStyle = 48
oG2antt.GridLineColor = 14474460
var_Chart = oG2antt.Chart
	var_Chart.FirstVisibleDate = {09/01/1994}
	var_Chart.LevelCount = 2
	' var_Chart.PaneWidth(.f.) = 256
	oG2antt.TemplateDef = "dim var_Chart"
	oG2antt.TemplateDef = var_Chart
	oG2antt.Template = "var_Chart.PaneWidth(False) = 256"

	var_Bar = var_Chart.Bars.Item("Task")
		var_Bar.Height = 15
		var_Bar.Color = 8421504
		var_Bar.StartColor = 52428
		var_Bar.EndColor = var_Bar.StartColor
		var_Bar.OverlaidType = 3
		var_Bar.OverlaidGroup = "Task,TaskB"
		var_Bar.Pattern = 96 'exPatternGradientVBox + exPatternBox
	var_Bar1 = var_Chart.Bars.Copy("Task","TaskB")
		var_Bar1.Color = 8421504
		var_Bar1.StartColor = 39321
		var_Bar1.EndColor = var_Bar1.StartColor
	var_Bar2 = var_Chart.Bars.Item("Summary")
		var_Bar2.OverlaidType = 3
		var_Bar2.OverlaidGroup = "Summary,SummaryB"
		var_Bar2.Color = 52428
		var_Bar2.StartColor = var_Bar2.Color
		var_Bar2.EndColor = var_Bar2.Color
	var_Bar3 = var_Chart.Bars.Copy("Summary","SummaryB")
		var_Bar3.Color = 39321
		var_Bar3.StartColor = var_Bar3.Color
		var_Bar3.EndColor = var_Bar3.Color
oG2antt.BackColorSortBar = oG2antt.BackColor
oG2antt.ColumnAutoResize = .f.
rs = OLE.Create("ADOR.Recordset")
	rs.Open("Orders","Provider=Microsoft.ACE.OLEDB.12.0;Data Source=C:\Program Files\Exontrol\ExG2antt\Sample\Access\misc.accdb",3,3)
oG2antt.DataSource = rs
oG2antt.Debug = .t.
oG2antt.Columns.Item(0).Data = -1
oG2antt.Layout = "singlesort=\"C5:1\";multiplesort=\" C1:2\""
oG2antt.EndUpdate()
|
|
1811
|
How can I filter for multiple captions on a single column, using OR clause
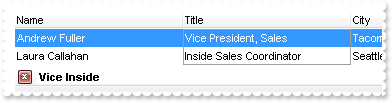
Dim h0 as N
Dim oG2antt as P
Dim var_Column as local
Dim var_Column1 as P
Dim var_Columns as P
Dim var_Items as P

oG2antt = topparent:CONTROL_ACTIVEX1.activex
oG2antt.BeginUpdate()
oG2antt.ColumnAutoResize = .t.
oG2antt.ContinueColumnScroll = .f.
oG2antt.MarkSearchColumn = .t.
oG2antt.SearchColumnIndex = 1
oG2antt.FilterBarPromptVisible = .t.
var_Columns = oG2antt.Columns
	' var_Columns.Add("Name").Width = 96
	var_Column = var_Columns.Add("Name")
	oG2antt.TemplateDef = "dim var_Column"
	oG2antt.TemplateDef = var_Column
	oG2antt.Template = "var_Column.Width = 96"

	var_Column1 = var_Columns.Add("Title")
		var_Column1.Width = 96
	var_Columns.Add("City")
var_Items = oG2antt.Items
	h0 = var_Items.AddItem("Nancy Davolio")
	' var_Items.CellValue(h0,1) = "Sales Representative"
	oG2antt.TemplateDef = "dim var_Items,h0"
	oG2antt.TemplateDef = var_Items
	oG2antt.TemplateDef = h0
	oG2antt.Template = "var_Items.CellValue(h0,1) = `Sales Representative`"

	' var_Items.CellValue(h0,2) = "Seattle"
	oG2antt.TemplateDef = "dim var_Items,h0"
	oG2antt.TemplateDef = var_Items
	oG2antt.TemplateDef = h0
	oG2antt.Template = "var_Items.CellValue(h0,2) = `Seattle`"

	h0 = var_Items.AddItem("Andrew Fuller")
	' var_Items.CellValue(h0,1) = "Vice President, Sales"
	oG2antt.TemplateDef = "dim var_Items,h0"
	oG2antt.TemplateDef = var_Items
	oG2antt.TemplateDef = h0
	oG2antt.Template = "var_Items.CellValue(h0,1) = `Vice President, Sales`"

	' var_Items.CellValue(h0,2) = "Tacoma"
	oG2antt.TemplateDef = "dim var_Items,h0"
	oG2antt.TemplateDef = var_Items
	oG2antt.TemplateDef = h0
	oG2antt.Template = "var_Items.CellValue(h0,2) = `Tacoma`"

	' var_Items.SelectItem(h0) = .t.
	oG2antt.TemplateDef = "dim var_Items,h0"
	oG2antt.TemplateDef = var_Items
	oG2antt.TemplateDef = h0
	oG2antt.Template = "var_Items.SelectItem(h0) = True"

	h0 = var_Items.AddItem("Janet Leverling")
	' var_Items.CellValue(h0,1) = "Sales Representative"
	oG2antt.TemplateDef = "dim var_Items,h0"
	oG2antt.TemplateDef = var_Items
	oG2antt.TemplateDef = h0
	oG2antt.Template = "var_Items.CellValue(h0,1) = `Sales Representative`"

	' var_Items.CellValue(h0,2) = "Kirkland"
	oG2antt.TemplateDef = "dim var_Items,h0"
	oG2antt.TemplateDef = var_Items
	oG2antt.TemplateDef = h0
	oG2antt.Template = "var_Items.CellValue(h0,2) = `Kirkland`"

	h0 = var_Items.AddItem("Margaret Peacock")
	' var_Items.CellValue(h0,1) = "Sales Representative"
	oG2antt.TemplateDef = "dim var_Items,h0"
	oG2antt.TemplateDef = var_Items
	oG2antt.TemplateDef = h0
	oG2antt.Template = "var_Items.CellValue(h0,1) = `Sales Representative`"

	' var_Items.CellValue(h0,2) = "Redmond"
	oG2antt.TemplateDef = "dim var_Items,h0"
	oG2antt.TemplateDef = var_Items
	oG2antt.TemplateDef = h0
	oG2antt.Template = "var_Items.CellValue(h0,2) = `Redmond`"

	h0 = var_Items.AddItem("Steven Buchanan")
	' var_Items.CellValue(h0,1) = "Sales Manager"
	oG2antt.TemplateDef = "dim var_Items,h0"
	oG2antt.TemplateDef = var_Items
	oG2antt.TemplateDef = h0
	oG2antt.Template = "var_Items.CellValue(h0,1) = `Sales Manager`"

	' var_Items.CellValue(h0,2) = "London"
	oG2antt.TemplateDef = "dim var_Items,h0"
	oG2antt.TemplateDef = var_Items
	oG2antt.TemplateDef = h0
	oG2antt.Template = "var_Items.CellValue(h0,2) = `London`"

	h0 = var_Items.AddItem("Michael Suyama")
	' var_Items.CellValue(h0,1) = "Sales Representative"
	oG2antt.TemplateDef = "dim var_Items,h0"
	oG2antt.TemplateDef = var_Items
	oG2antt.TemplateDef = h0
	oG2antt.Template = "var_Items.CellValue(h0,1) = `Sales Representative`"

	' var_Items.CellValue(h0,2) = "London"
	oG2antt.TemplateDef = "dim var_Items,h0"
	oG2antt.TemplateDef = var_Items
	oG2antt.TemplateDef = h0
	oG2antt.Template = "var_Items.CellValue(h0,2) = `London`"

	h0 = var_Items.AddItem("Robert King")
	' var_Items.CellValue(h0,1) = "Sales Representative"
	oG2antt.TemplateDef = "dim var_Items,h0"
	oG2antt.TemplateDef = var_Items
	oG2antt.TemplateDef = h0
	oG2antt.Template = "var_Items.CellValue(h0,1) = `Sales Representative`"

	' var_Items.CellValue(h0,2) = "London"
	oG2antt.TemplateDef = "dim var_Items,h0"
	oG2antt.TemplateDef = var_Items
	oG2antt.TemplateDef = h0
	oG2antt.Template = "var_Items.CellValue(h0,2) = `London`"

	h0 = var_Items.AddItem("Laura Callahan")
	' var_Items.CellValue(h0,1) = "Inside Sales Coordinator"
	oG2antt.TemplateDef = "dim var_Items,h0"
	oG2antt.TemplateDef = var_Items
	oG2antt.TemplateDef = h0
	oG2antt.Template = "var_Items.CellValue(h0,1) = `Inside Sales Coordinator`"

	' var_Items.CellValue(h0,2) = "Seattle"
	oG2antt.TemplateDef = "dim var_Items,h0"
	oG2antt.TemplateDef = var_Items
	oG2antt.TemplateDef = h0
	oG2antt.Template = "var_Items.CellValue(h0,2) = `Seattle`"

	h0 = var_Items.AddItem("Anne Dodsworth")
	' var_Items.CellValue(h0,1) = "Sales Representative"
	oG2antt.TemplateDef = "dim var_Items,h0"
	oG2antt.TemplateDef = var_Items
	oG2antt.TemplateDef = h0
	oG2antt.Template = "var_Items.CellValue(h0,1) = `Sales Representative`"

	' var_Items.CellValue(h0,2) = "London"
	oG2antt.TemplateDef = "dim var_Items,h0"
	oG2antt.TemplateDef = var_Items
	oG2antt.TemplateDef = h0
	oG2antt.Template = "var_Items.CellValue(h0,2) = `London`"

oG2antt.FilterBarPromptColumns = "1"
oG2antt.FilterBarPromptPattern = "Vice Inside"
oG2antt.FilterBarPromptType = 2
oG2antt.EndUpdate()
|
|
1810
|
How can I filter for multiple captions on a single column, using AND clause
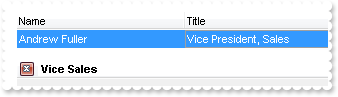
Dim h0 as N
Dim oG2antt as P
Dim var_Column as local
Dim var_Column1 as P
Dim var_Columns as P
Dim var_Items as P

oG2antt = topparent:CONTROL_ACTIVEX1.activex
oG2antt.BeginUpdate()
oG2antt.ColumnAutoResize = .t.
oG2antt.ContinueColumnScroll = .f.
oG2antt.MarkSearchColumn = .t.
oG2antt.SearchColumnIndex = 1
oG2antt.FilterBarPromptVisible = .t.
var_Columns = oG2antt.Columns
	' var_Columns.Add("Name").Width = 96
	var_Column = var_Columns.Add("Name")
	oG2antt.TemplateDef = "dim var_Column"
	oG2antt.TemplateDef = var_Column
	oG2antt.Template = "var_Column.Width = 96"

	var_Column1 = var_Columns.Add("Title")
		var_Column1.Width = 96
	var_Columns.Add("City")
var_Items = oG2antt.Items
	h0 = var_Items.AddItem("Nancy Davolio")
	' var_Items.CellValue(h0,1) = "Sales Representative"
	oG2antt.TemplateDef = "dim var_Items,h0"
	oG2antt.TemplateDef = var_Items
	oG2antt.TemplateDef = h0
	oG2antt.Template = "var_Items.CellValue(h0,1) = `Sales Representative`"

	' var_Items.CellValue(h0,2) = "Seattle"
	oG2antt.TemplateDef = "dim var_Items,h0"
	oG2antt.TemplateDef = var_Items
	oG2antt.TemplateDef = h0
	oG2antt.Template = "var_Items.CellValue(h0,2) = `Seattle`"

	h0 = var_Items.AddItem("Andrew Fuller")
	' var_Items.CellValue(h0,1) = "Vice President, Sales"
	oG2antt.TemplateDef = "dim var_Items,h0"
	oG2antt.TemplateDef = var_Items
	oG2antt.TemplateDef = h0
	oG2antt.Template = "var_Items.CellValue(h0,1) = `Vice President, Sales`"

	' var_Items.CellValue(h0,2) = "Tacoma"
	oG2antt.TemplateDef = "dim var_Items,h0"
	oG2antt.TemplateDef = var_Items
	oG2antt.TemplateDef = h0
	oG2antt.Template = "var_Items.CellValue(h0,2) = `Tacoma`"

	' var_Items.SelectItem(h0) = .t.
	oG2antt.TemplateDef = "dim var_Items,h0"
	oG2antt.TemplateDef = var_Items
	oG2antt.TemplateDef = h0
	oG2antt.Template = "var_Items.SelectItem(h0) = True"

	h0 = var_Items.AddItem("Janet Leverling")
	' var_Items.CellValue(h0,1) = "Sales Representative"
	oG2antt.TemplateDef = "dim var_Items,h0"
	oG2antt.TemplateDef = var_Items
	oG2antt.TemplateDef = h0
	oG2antt.Template = "var_Items.CellValue(h0,1) = `Sales Representative`"

	' var_Items.CellValue(h0,2) = "Kirkland"
	oG2antt.TemplateDef = "dim var_Items,h0"
	oG2antt.TemplateDef = var_Items
	oG2antt.TemplateDef = h0
	oG2antt.Template = "var_Items.CellValue(h0,2) = `Kirkland`"

	h0 = var_Items.AddItem("Margaret Peacock")
	' var_Items.CellValue(h0,1) = "Sales Representative"
	oG2antt.TemplateDef = "dim var_Items,h0"
	oG2antt.TemplateDef = var_Items
	oG2antt.TemplateDef = h0
	oG2antt.Template = "var_Items.CellValue(h0,1) = `Sales Representative`"

	' var_Items.CellValue(h0,2) = "Redmond"
	oG2antt.TemplateDef = "dim var_Items,h0"
	oG2antt.TemplateDef = var_Items
	oG2antt.TemplateDef = h0
	oG2antt.Template = "var_Items.CellValue(h0,2) = `Redmond`"

	h0 = var_Items.AddItem("Steven Buchanan")
	' var_Items.CellValue(h0,1) = "Sales Manager"
	oG2antt.TemplateDef = "dim var_Items,h0"
	oG2antt.TemplateDef = var_Items
	oG2antt.TemplateDef = h0
	oG2antt.Template = "var_Items.CellValue(h0,1) = `Sales Manager`"

	' var_Items.CellValue(h0,2) = "London"
	oG2antt.TemplateDef = "dim var_Items,h0"
	oG2antt.TemplateDef = var_Items
	oG2antt.TemplateDef = h0
	oG2antt.Template = "var_Items.CellValue(h0,2) = `London`"

	h0 = var_Items.AddItem("Michael Suyama")
	' var_Items.CellValue(h0,1) = "Sales Representative"
	oG2antt.TemplateDef = "dim var_Items,h0"
	oG2antt.TemplateDef = var_Items
	oG2antt.TemplateDef = h0
	oG2antt.Template = "var_Items.CellValue(h0,1) = `Sales Representative`"

	' var_Items.CellValue(h0,2) = "London"
	oG2antt.TemplateDef = "dim var_Items,h0"
	oG2antt.TemplateDef = var_Items
	oG2antt.TemplateDef = h0
	oG2antt.Template = "var_Items.CellValue(h0,2) = `London`"

	h0 = var_Items.AddItem("Robert King")
	' var_Items.CellValue(h0,1) = "Sales Representative"
	oG2antt.TemplateDef = "dim var_Items,h0"
	oG2antt.TemplateDef = var_Items
	oG2antt.TemplateDef = h0
	oG2antt.Template = "var_Items.CellValue(h0,1) = `Sales Representative`"

	' var_Items.CellValue(h0,2) = "London"
	oG2antt.TemplateDef = "dim var_Items,h0"
	oG2antt.TemplateDef = var_Items
	oG2antt.TemplateDef = h0
	oG2antt.Template = "var_Items.CellValue(h0,2) = `London`"

	h0 = var_Items.AddItem("Laura Callahan")
	' var_Items.CellValue(h0,1) = "Inside Sales Coordinator"
	oG2antt.TemplateDef = "dim var_Items,h0"
	oG2antt.TemplateDef = var_Items
	oG2antt.TemplateDef = h0
	oG2antt.Template = "var_Items.CellValue(h0,1) = `Inside Sales Coordinator`"

	' var_Items.CellValue(h0,2) = "Seattle"
	oG2antt.TemplateDef = "dim var_Items,h0"
	oG2antt.TemplateDef = var_Items
	oG2antt.TemplateDef = h0
	oG2antt.Template = "var_Items.CellValue(h0,2) = `Seattle`"

	h0 = var_Items.AddItem("Anne Dodsworth")
	' var_Items.CellValue(h0,1) = "Sales Representative"
	oG2antt.TemplateDef = "dim var_Items,h0"
	oG2antt.TemplateDef = var_Items
	oG2antt.TemplateDef = h0
	oG2antt.Template = "var_Items.CellValue(h0,1) = `Sales Representative`"

	' var_Items.CellValue(h0,2) = "London"
	oG2antt.TemplateDef = "dim var_Items,h0"
	oG2antt.TemplateDef = var_Items
	oG2antt.TemplateDef = h0
	oG2antt.Template = "var_Items.CellValue(h0,2) = `London`"

oG2antt.FilterBarPromptColumns = "1"
oG2antt.FilterBarPromptPattern = "Vice Sales"
oG2antt.FilterBarPromptType = 1
oG2antt.EndUpdate()
|
|
1809
|
How can I display the limits/margins of the project, in the overview part of the control
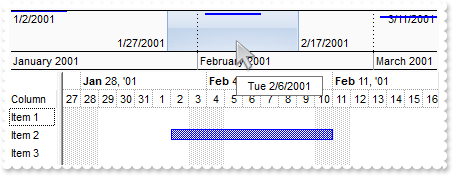
Dim oG2antt as P
Dim var_Chart as P
Dim var_Items as P

oG2antt = topparent:CONTROL_ACTIVEX1.activex
oG2antt.BeginUpdate()
oG2antt.VisualAppearance.Add(1,"gBFLBCJwBAEHhEJAAEhABVADg6AADACAxSDEMQBQKAAzQFAYbhgHCGAAGUYBRgmFgAQhFcZQSBcEgTDaMYzgMBYJhEMQyDSAUIjPEyMg0DjIIwgJIUaw0GSXIRkGQZChGJooTJQMrTZIEbQxHSkIyRVTmZACS5NRZPYy0FAkQhlFSbJBCOKwVomR5KUxTVg1DJwahLCKULLhGI7KgObIRSJOcZ1XAdCQ0cB0XpAC6LaqSA4nSjKcqwJKEZRJIyjJwgSrrWhePoJYBVAAQPQdDYaCivK5uWK6PqKUIlZBQGQVNS1MRrLSEcwgPKgAyzDadZzfQAWTZFTQjN61RgtXR6eyoAJ0aziFDVFo0WRlEwacorGhcbgPPrCRrxGBVNwgGOJo4kIeASB0Zw/iGDoym6dobh2XpiDWJo5HMd56h6dxjlICIEhQDQmDOIZUmQZZlAADpYHIEQ3nUGgNhCEIhAkawamAAAYEWRAGB2bA2EqYg2AyA4glgPgSgQYRIEIFoEmEeBWBiBphFAAgPDwDgDEycQ4A0Q5IwkDwjgyWA8k4SIsmUNoPEOFJbD0DhjHINA3E8Q4eDiDojhiYJmg+Ixokic4LmKQxiCkNk2CCX4DmGaA0nAN4NBiDJSDwTgTEycg4E0WIYlcPJiiiMJZhCTYpgCcw5g2OYOGWGQmCkEJkheYopGoVw1GSGQuA2ExIlOQJcDOZJzEDSJNBiAgiU4Q5GCeChNHkHJygsaBzGaCYimiCY0mMNZoCMWhUDUJ5pkYTIDk6YxwkwO5NlMOoch6JQJm4U4JCIMxWFSKbCBoKIgmJDAuDgKhohKIoTk0GhaHOJgNiMKJuDaaYzHCTYnAyaZmjSKIiDiCghjEYg6AaR4yk0OpOiFSQLAKNgjGcQ40lkMhOmqZo7DKTpzG6Pw3CmYx2HiNAsCqBh8h6Z5bh6T4oC0G4Im+OAtlMNpTjUTYDCKVo2C3QBLi6a5bH6YY4EyehzAGO4wEwDoejwK5rnK95vDgPJsDWTBjjSWAxnEK5aleNhriuawKi8Lp7H8HpHHGXBskyQpxguXwNgMTpDFiRZDnEExfBSPRvHuXwYkycYslae5NjMQwrDGNZxFyHINDsDRTBMKZKnKLIwm2S4xF0Jw8lKTIcm9eA0hyQwuksM5jiyVQwnQDQIlaVo0EyLwQlGcRNCME5EjKfYXGSWEhDMQ5QnOahHG6KwoFOCoFiOaBNlcdIjiQag7HOL0dwuxKC1aeNQI4BQihNDoEwXowxmh8CIL8Yg8ROBfASMcaIOR6CHBkMgLgrwUjLHkHMG4NQaBzE4MQaIyw5gxEsH0Dw9FBBNA6PUDoLwpjTHqF0N4WQShSHgGwcY2RkhdFCL8bYdwOivDqNse4fRnh5G+PYEgaR1B0E4B4D4ixxB4G8E8SI5R8D+DeJUc4eRPB/EaJ8DwpwojDHUPofwtxYjtH2F4d4sx3j7E+AcXo8B9geFCNYOIHhfg/GmPQPoXw3jZHuPoX4hxuj1H8J8T43RPhDEgM8eo/B/iQGuPwfxEh1guAIAwQAgCAg")
oG2antt.BackColorLevelHeader = oG2antt.BackColor
var_Chart = oG2antt.Chart
	var_Chart.LevelCount = 2
	var_Chart.FirstVisibleDate = {01/01/2001}
	' var_Chart.PaneWidth(.f.) = 48
	oG2antt.TemplateDef = "dim var_Chart"
	oG2antt.TemplateDef = var_Chart
	oG2antt.Template = "var_Chart.PaneWidth(False) = 48"

	var_Chart.OverviewVisible = 31746 '400 + exOverviewShowSelMargins + exOverviewShowMargins + exOverviewShowDateTimeScaleBottom + exOverviewShowAllVisible
	var_Chart.OverviewHeight = 64
	var_Chart.OverviewSelBackColor = 16777216
	var_Chart.OverviewBackColor = 16448250
oG2antt.Columns.Add("Column")
var_Items = oG2antt.Items
	var_Items.AddBar(var_Items.AddItem("Item 1"),"Task",{01/02/2001},{01/11/2001})
	var_Items.AddBar(var_Items.AddItem("Item 2"),"Task",{02/02/2001},{02/11/2001})
	var_Items.AddBar(var_Items.AddItem("Item 3"),"Task",{03/02/2001},{03/11/2001})
oG2antt.EndUpdate()
|
|
1808
|
Is it possible to display a time-scale for the overview part of the control (separated)
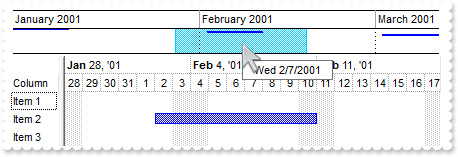
Dim oG2antt as P
Dim var_Chart as P
Dim var_Items as P

oG2antt = topparent:CONTROL_ACTIVEX1.activex
oG2antt.BeginUpdate()
oG2antt.BackColorLevelHeader = oG2antt.BackColor
var_Chart = oG2antt.Chart
	var_Chart.FirstVisibleDate = {01/01/2001}
	' var_Chart.PaneWidth(.f.) = 48
	oG2antt.TemplateDef = "dim var_Chart"
	oG2antt.TemplateDef = var_Chart
	oG2antt.Template = "var_Chart.PaneWidth(False) = 48"

	var_Chart.OverviewVisible = 5122 'exOverviewShowDateTimeScaleSplit + exOverviewShowAllVisible
	var_Chart.OverviewHeight = 48
	var_Chart.LevelCount = 2
oG2antt.Columns.Add("Column")
var_Items = oG2antt.Items
	var_Items.AddBar(var_Items.AddItem("Item 1"),"Task",{01/02/2001},{01/11/2001})
	var_Items.AddBar(var_Items.AddItem("Item 2"),"Task",{02/02/2001},{02/11/2001})
	var_Items.AddBar(var_Items.AddItem("Item 3"),"Task",{03/02/2001},{03/11/2001})
oG2antt.EndUpdate()
|
|
1807
|
Is it possible to display a time-scale for the overview part of the control
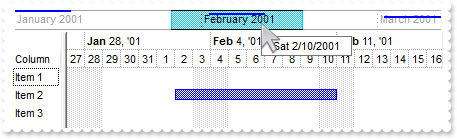
Dim oG2antt as P
Dim var_Chart as P
Dim var_Items as P

oG2antt = topparent:CONTROL_ACTIVEX1.activex
oG2antt.BeginUpdate()
oG2antt.BackColorLevelHeader = oG2antt.BackColor
var_Chart = oG2antt.Chart
	var_Chart.FirstVisibleDate = {01/01/2001}
	' var_Chart.PaneWidth(.f.) = 48
	oG2antt.TemplateDef = "dim var_Chart"
	oG2antt.TemplateDef = var_Chart
	oG2antt.Template = "var_Chart.PaneWidth(False) = 48"

	var_Chart.OverviewVisible = 4098 'exOverviewShowDateTimeScale + exOverviewShowAllVisible
	var_Chart.LevelCount = 2
oG2antt.Columns.Add("Column")
var_Items = oG2antt.Items
	var_Items.AddBar(var_Items.AddItem("Item 1"),"Task",{01/02/2001},{01/11/2001})
	var_Items.AddBar(var_Items.AddItem("Item 2"),"Task",{02/02/2001},{02/11/2001})
	var_Items.AddBar(var_Items.AddItem("Item 3"),"Task",{03/02/2001},{03/11/2001})
oG2antt.EndUpdate()
|
|
1806
|
How can I display the time-scale only, in the overview part of the control
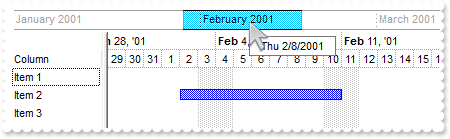
Dim oG2antt as P
Dim var_Chart as P
Dim var_Items as P

oG2antt = topparent:CONTROL_ACTIVEX1.activex
oG2antt.BeginUpdate()
oG2antt.BackColorLevelHeader = oG2antt.BackColor
var_Chart = oG2antt.Chart
	var_Chart.FirstVisibleDate = {01/01/2001}
	' var_Chart.PaneWidth(.f.) = 48
	oG2antt.TemplateDef = "dim var_Chart"
	oG2antt.TemplateDef = var_Chart
	oG2antt.Template = "var_Chart.PaneWidth(False) = 48"

	var_Chart.OverviewVisible = 4610 'exOverviewShowDateTimeScale + exOverviewHideBars + exOverviewShowAllVisible
	var_Chart.LevelCount = 2
oG2antt.Columns.Add("Column")
var_Items = oG2antt.Items
	var_Items.AddBar(var_Items.AddItem("Item 1"),"Task",{01/02/2001},{01/11/2001})
	var_Items.AddBar(var_Items.AddItem("Item 2"),"Task",{02/02/2001},{02/11/2001})
	var_Items.AddBar(var_Items.AddItem("Item 3"),"Task",{03/02/2001},{03/11/2001})
oG2antt.EndUpdate()
|
|
1805
|
How can I detect that the mouse pointer is within an InsideZoom object
' Occurs when the user moves the mouse.
function MouseMove as v (Button  as  N, Shift  as  N, X  as  OLE::Exontrol.G2antt.1::OLE_XPOS_PIXELS, Y  as  OLE::Exontrol.G2antt.1::OLE_YPOS_PIXELS)
	Dim d as
	Dim iz as P
	Dim var_Chart as P
	oG2antt = topparent:CONTROL_ACTIVEX1.activex
	var_Chart = oG2antt.Chart
		d = var_Chart.DateFromPoint(-1,-1)
		iz = var_Chart.InsideZooms.Contains(d)
		? d
		? "If the iz object is nothing, the date is not zoomed, else it is."
		? iz
end function

Dim oG2antt as P
Dim var_Chart as P

oG2antt = topparent:CONTROL_ACTIVEX1.activex
oG2antt.BeginUpdate()
var_Chart = oG2antt.Chart
	var_Chart.FirstVisibleDate = {01/01/2001}
	' var_Chart.PaneWidth(.f.) = 0
	oG2antt.TemplateDef = "dim var_Chart"
	oG2antt.TemplateDef = var_Chart
	oG2antt.Template = "var_Chart.PaneWidth(0) = 0"

	var_Chart.LevelCount = 2
	var_Chart.FirstWeekDay = 1
	var_Chart.AllowInsideZoom = .t.
	var_Chart.InsideZooms.Add({01/10/2001})
oG2antt.EndUpdate()
|
|
1804
|
Is it possible to word-wrap text/caption on the bar, so it gets displayed on multiple lines
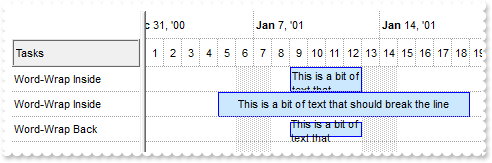
Dim h as N
Dim oG2antt as P
Dim var_Bar as P
Dim var_Bar1 as P
Dim var_Chart as P
Dim var_Items as P

oG2antt = topparent:CONTROL_ACTIVEX1.activex
oG2antt.BeginUpdate()
oG2antt.ScrollBySingleLine = .t.
oG2antt.ItemsAllowSizing = -1
oG2antt.DrawGridLines = 1
oG2antt.HeaderHeight = 28
oG2antt.DefaultItemHeight = 24
oG2antt.BackColorLevelHeader = oG2antt.BackColor
oG2antt.HeaderAppearance = 5
oG2antt.Columns.Add("Tasks")
var_Chart = oG2antt.Chart
	var_Chart.LevelCount = 2
	' var_Chart.PaneWidth(.f.) = 128
	oG2antt.TemplateDef = "dim var_Chart"
	oG2antt.TemplateDef = var_Chart
	oG2antt.Template = "var_Chart.PaneWidth(False) = 128"

	var_Chart.FirstVisibleDate = {01/01/2001}
	var_Chart.DrawGridLines = 1
	var_Bar = var_Chart.Bars.Copy("Task","TaskB")
		var_Bar.Height = 15
		var_Bar.Pattern = 32
		var_Bar.StartColor = 16771276
		var_Bar.EndColor = var_Bar.StartColor
		var_Bar.Color = 16711680
	var_Bar1 = var_Chart.Bars.Item("Task")
		var_Bar1.Height = -1
		var_Bar1.Pattern = 32
		var_Bar1.StartColor = 16771276
		var_Bar1.EndColor = var_Bar1.StartColor
		var_Bar1.Color = 16711680
var_Items = oG2antt.Items
	h = var_Items.AddItem("Word-Wrap Inside")
	var_Items.AddBar(h,"Task",{01/09/2001},{01/13/2001},"A1")
	' var_Items.ItemBar(h,"A1",53) = "none[(2,2,100%-4,100%-4),text=`This is a bit of text that should break the line`,wordwrap]"
	oG2antt.TemplateDef = "dim var_Items,h"
	oG2antt.TemplateDef = var_Items
	oG2antt.TemplateDef = h
	oG2antt.Template = "var_Items.ItemBar(h,`A1`,53) = `none[(2,2,100%-4,100%-4),text=``This is a bit of text that should break the line``,wordwrap]`"

	h = var_Items.AddItem("Word-Wrap Inside")
	var_Items.AddBar(h,"Task",{01/05/2001},{01/19/2001},"A2")
	' var_Items.ItemBar(h,"A2",53) = "none[(2,2,100%-4,100%-4),align=0x11,text=`This is a bit of text that should break the line`,wordwrap]"
	oG2antt.TemplateDef = "dim var_Items,h"
	oG2antt.TemplateDef = var_Items
	oG2antt.TemplateDef = h
	oG2antt.Template = "var_Items.ItemBar(h,`A2`,53) = `none[(2,2,100%-4,100%-4),align=0x11,text=``This is a bit of text that should break the line``,wordwrap]`"

	h = var_Items.AddItem("Word-Wrap Back")
	var_Items.AddBar(h,"TaskB",{01/09/2001},{01/13/2001},"A3")
	' var_Items.ItemBar(h,"A3",53) = "client[align=0x11,text=`This is a bit of text that should break the line`,wordwrap]"
	oG2antt.TemplateDef = "dim var_Items,h"
	oG2antt.TemplateDef = var_Items
	oG2antt.TemplateDef = h
	oG2antt.Template = "var_Items.ItemBar(h,`A3`,53) = `client[align=0x11,text=``This is a bit of text that should break the line``,wordwrap]`"

	' var_Items.ItemBar(h,"A3",54) = 2
	oG2antt.TemplateDef = "dim var_Items,h"
	oG2antt.TemplateDef = var_Items
	oG2antt.TemplateDef = h
	oG2antt.Template = "var_Items.ItemBar(h,`A3`,54) = 2"

oG2antt.EndUpdate()
|
|
1803
|
Can I set the search box / filterbarprompt to invisible, so I can use my own input and *string* via VBA
Dim h0 as N
Dim oG2antt as P
Dim var_Chart as local
Dim var_Column as local
Dim var_Column1 as local
Dim var_Columns as P
Dim var_Items as P

oG2antt = topparent:CONTROL_ACTIVEX1.activex
oG2antt.BeginUpdate()
oG2antt.ColumnAutoResize = .t.
oG2antt.ContinueColumnScroll = .f.
oG2antt.MarkSearchColumn = .f.
oG2antt.SearchColumnIndex = 1
oG2antt.FilterBarHeight = 0
oG2antt.FilterBarPromptVisible = .t.
' oG2antt.Chart.PaneWidth(.t.) = 0
var_Chart = oG2antt.Chart
oG2antt.TemplateDef = "dim var_Chart"
oG2antt.TemplateDef = var_Chart
oG2antt.Template = "var_Chart.PaneWidth(True) = 0"

var_Columns = oG2antt.Columns
	' var_Columns.Add("Name").Width = 96
	var_Column = var_Columns.Add("Name")
	oG2antt.TemplateDef = "dim var_Column"
	oG2antt.TemplateDef = var_Column
	oG2antt.Template = "var_Column.Width = 96"

	' var_Columns.Add("Title").Width = 96
	var_Column1 = var_Columns.Add("Title")
	oG2antt.TemplateDef = "dim var_Column1"
	oG2antt.TemplateDef = var_Column1
	oG2antt.Template = "var_Column1.Width = 96"

	var_Columns.Add("City")
var_Items = oG2antt.Items
	h0 = var_Items.AddItem("Nancy Davolio")
	' var_Items.CellValue(h0,1) = "Sales Representative"
	oG2antt.TemplateDef = "dim var_Items,h0"
	oG2antt.TemplateDef = var_Items
	oG2antt.TemplateDef = h0
	oG2antt.Template = "var_Items.CellValue(h0,1) = `Sales Representative`"

	' var_Items.CellValue(h0,2) = "Seattle"
	oG2antt.TemplateDef = "dim var_Items,h0"
	oG2antt.TemplateDef = var_Items
	oG2antt.TemplateDef = h0
	oG2antt.Template = "var_Items.CellValue(h0,2) = `Seattle`"

	h0 = var_Items.AddItem("Andrew Fuller")
	' var_Items.CellValue(h0,1) = "Vice President, Sales"
	oG2antt.TemplateDef = "dim var_Items,h0"
	oG2antt.TemplateDef = var_Items
	oG2antt.TemplateDef = h0
	oG2antt.Template = "var_Items.CellValue(h0,1) = `Vice President, Sales`"

	' var_Items.CellValue(h0,2) = "Tacoma"
	oG2antt.TemplateDef = "dim var_Items,h0"
	oG2antt.TemplateDef = var_Items
	oG2antt.TemplateDef = h0
	oG2antt.Template = "var_Items.CellValue(h0,2) = `Tacoma`"

	' var_Items.SelectItem(h0) = .t.
	oG2antt.TemplateDef = "dim var_Items,h0"
	oG2antt.TemplateDef = var_Items
	oG2antt.TemplateDef = h0
	oG2antt.Template = "var_Items.SelectItem(h0) = True"

	h0 = var_Items.AddItem("Janet Leverling")
	' var_Items.CellValue(h0,1) = "Sales Representative"
	oG2antt.TemplateDef = "dim var_Items,h0"
	oG2antt.TemplateDef = var_Items
	oG2antt.TemplateDef = h0
	oG2antt.Template = "var_Items.CellValue(h0,1) = `Sales Representative`"

	' var_Items.CellValue(h0,2) = "Kirkland"
	oG2antt.TemplateDef = "dim var_Items,h0"
	oG2antt.TemplateDef = var_Items
	oG2antt.TemplateDef = h0
	oG2antt.Template = "var_Items.CellValue(h0,2) = `Kirkland`"

	h0 = var_Items.AddItem("Margaret Peacock")
	' var_Items.CellValue(h0,1) = "Sales Representative"
	oG2antt.TemplateDef = "dim var_Items,h0"
	oG2antt.TemplateDef = var_Items
	oG2antt.TemplateDef = h0
	oG2antt.Template = "var_Items.CellValue(h0,1) = `Sales Representative`"

	' var_Items.CellValue(h0,2) = "Redmond"
	oG2antt.TemplateDef = "dim var_Items,h0"
	oG2antt.TemplateDef = var_Items
	oG2antt.TemplateDef = h0
	oG2antt.Template = "var_Items.CellValue(h0,2) = `Redmond`"

	h0 = var_Items.AddItem("Steven Buchanan")
	' var_Items.CellValue(h0,1) = "Sales Manager"
	oG2antt.TemplateDef = "dim var_Items,h0"
	oG2antt.TemplateDef = var_Items
	oG2antt.TemplateDef = h0
	oG2antt.Template = "var_Items.CellValue(h0,1) = `Sales Manager`"

	' var_Items.CellValue(h0,2) = "London"
	oG2antt.TemplateDef = "dim var_Items,h0"
	oG2antt.TemplateDef = var_Items
	oG2antt.TemplateDef = h0
	oG2antt.Template = "var_Items.CellValue(h0,2) = `London`"

	h0 = var_Items.AddItem("Michael Suyama")
	' var_Items.CellValue(h0,1) = "Sales Representative"
	oG2antt.TemplateDef = "dim var_Items,h0"
	oG2antt.TemplateDef = var_Items
	oG2antt.TemplateDef = h0
	oG2antt.Template = "var_Items.CellValue(h0,1) = `Sales Representative`"

	' var_Items.CellValue(h0,2) = "London"
	oG2antt.TemplateDef = "dim var_Items,h0"
	oG2antt.TemplateDef = var_Items
	oG2antt.TemplateDef = h0
	oG2antt.Template = "var_Items.CellValue(h0,2) = `London`"

	h0 = var_Items.AddItem("Robert King")
	' var_Items.CellValue(h0,1) = "Sales Representative"
	oG2antt.TemplateDef = "dim var_Items,h0"
	oG2antt.TemplateDef = var_Items
	oG2antt.TemplateDef = h0
	oG2antt.Template = "var_Items.CellValue(h0,1) = `Sales Representative`"

	' var_Items.CellValue(h0,2) = "London"
	oG2antt.TemplateDef = "dim var_Items,h0"
	oG2antt.TemplateDef = var_Items
	oG2antt.TemplateDef = h0
	oG2antt.Template = "var_Items.CellValue(h0,2) = `London`"

	h0 = var_Items.AddItem("Laura Callahan")
	' var_Items.CellValue(h0,1) = "Inside Sales Coordinator"
	oG2antt.TemplateDef = "dim var_Items,h0"
	oG2antt.TemplateDef = var_Items
	oG2antt.TemplateDef = h0
	oG2antt.Template = "var_Items.CellValue(h0,1) = `Inside Sales Coordinator`"

	' var_Items.CellValue(h0,2) = "Seattle"
	oG2antt.TemplateDef = "dim var_Items,h0"
	oG2antt.TemplateDef = var_Items
	oG2antt.TemplateDef = h0
	oG2antt.Template = "var_Items.CellValue(h0,2) = `Seattle`"

	h0 = var_Items.AddItem("Anne Dodsworth")
	' var_Items.CellValue(h0,1) = "Sales Representative"
	oG2antt.TemplateDef = "dim var_Items,h0"
	oG2antt.TemplateDef = var_Items
	oG2antt.TemplateDef = h0
	oG2antt.Template = "var_Items.CellValue(h0,1) = `Sales Representative`"

	' var_Items.CellValue(h0,2) = "London"
	oG2antt.TemplateDef = "dim var_Items,h0"
	oG2antt.TemplateDef = var_Items
	oG2antt.TemplateDef = h0
	oG2antt.Template = "var_Items.CellValue(h0,2) = `London`"

oG2antt.FilterBarPromptPattern = "London"
oG2antt.EndUpdate()
|
|
1802
|
How to load a hierarchy using the control's DataSource property (Parent-ID-Relation)
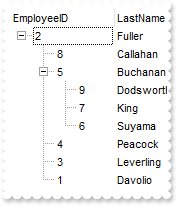
' Occurs after a new Item has been inserted to Items collection.
function AddItem as v (Item  as  OLE::Exontrol.G2antt.1::HITEM)
	Dim var_Items as P
	oG2antt = topparent:CONTROL_ACTIVEX1.activex
	var_Items = oG2antt.Items
		var_Items.SetParent(Item,var_Items.FindItem(var_Items.CellValue(Item,"ReportsTo"),"EmployeeID"))
end function

Dim oG2antt as P
Dim rs as P
Dim var_Chart as local
Dim var_Items as local

oG2antt = topparent:CONTROL_ACTIVEX1.activex
oG2antt.BeginUpdate()
' oG2antt.Chart.PaneWidth(.t.) = 0
var_Chart = oG2antt.Chart
oG2antt.TemplateDef = "dim var_Chart"
oG2antt.TemplateDef = var_Chart
oG2antt.Template = "var_Chart.PaneWidth(True) = 0"

oG2antt.LinesAtRoot = -1
oG2antt.ColumnAutoResize = .f.
oG2antt.ContinueColumnScroll = .f.
rs = OLE.Create("ADOR.Recordset")
	rs.Open("SELECT * FROM Employees ORDER BY ReportsTo","Provider=Microsoft.ACE.OLEDB.12.0;Data Source=C:\Program Files\Exontrol\ExG2antt\Sample\Access\misc.accdb",3,3)
oG2antt.DataSource = rs
' oG2antt.Items.ExpandItem(0) = .t.
var_Items = oG2antt.Items
oG2antt.TemplateDef = "dim var_Items"
oG2antt.TemplateDef = var_Items
oG2antt.Template = "var_Items.ExpandItem(0) = True"

oG2antt.EndUpdate()
|
|
1801
|
How can I highlight the limits/margins of a summary bar, according with the child bars
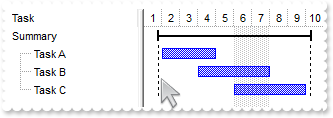
Dim hSummary as N
Dim hTask as N
Dim oG2antt as P
Dim var_Appearance as P
Dim var_Chart as P
Dim var_Items as P

oG2antt = topparent:CONTROL_ACTIVEX1.activex
oG2antt.BeginUpdate()
var_Appearance = oG2antt.VisualAppearance
	var_Appearance.Add(1,"gBFLBCJwBAEHhEJAAEhABRkIQAAYAQGKQYhiAKBQAGaAoDDcMA4QwAAyjhwkAIIQK/cZRPC0Ow8GSEZAgOKIch6FgCQjEIxDKIsVRZEiDYRmGLpIiOJoWSQBUIyJKoAQ0f6fIziaTpNiGL4yTBPMzyJRcEx1GyBZ5negaAo2AwIQiUBomGahajkMqZQAJaCSCI2Y4eDZCIoTXR1WAxDq3ZruKpLUpOc4DOrEMIwCEBA=")
	var_Appearance.Add(2,"CP:1 -4 0 5 0")
	var_Appearance.Add(3,"gBFLBCJwBAEHhEJAAEhABOMGACAADACAxSDEMQBQKAAzQFAYbhgHCGAAGUYBRgmFgAQhFcZQSKUOQTDKMIziYBYJhEMQyDAAUIjOKsIhkGYcZAGQBJCjWGodQRHc5TNCMTRRECDY4kAYpAiKRYbSpAcyQHQ8bQtHwYKAoOg6JjWIAHRqCMI0XINHQ3FwaRJsCwoJhOZIDWZENDQTSsLSxJSkIRfe4wArNf4XVBVMqSdKEZRJLybJwADApAo2eIlQjJdQ4TSdBSdQwDLYhECpbwCT6JT7jGLQJZsNyvBLIYDrKA8UozFqHQRYNhxDZNShhM6rMigPQQAq8AKlRbVNzXLamLwHRS9BpoORhUjHD4bVxVOyaPpAAaBFbhI44QZOHYNYfjgaI0BySp8HMVZdlgaxtBqexWkqOw1lGbZzlwfQ0AwYR/gka5FiMGpgkQYYviGV4kBUWpmlsaYGHMEgACECQUAaEYMHQHRHCGFRBECRJkGQQgTGCVBoDYQhCgQJZoG4EIAGEFwGB+dwxHaB5iAabReggYhGnUToJGIRgCCiCBdjiNguGmYo4gIKoMGIKIeDSCYTGiXg4EITo3hAiJAICA==")
oG2antt.Columns.Add("Task")
var_Chart = oG2antt.Chart
	' var_Chart.PaneWidth(.f.) = 128
	oG2antt.TemplateDef = "dim var_Chart"
	oG2antt.TemplateDef = var_Chart
	oG2antt.Template = "var_Chart.PaneWidth(False) = 128"

	var_Chart.FirstVisibleDate = {01/01/2001}
	var_Chart.Bars.Item("Summary").Color = 50331648
var_Items = oG2antt.Items
	hSummary = var_Items.AddItem("Summary")
	var_Items.AddBar(hSummary,"Summary",{01/02/2001},{01/02/2001},"")
	hTask = var_Items.InsertItem(hSummary,,"Task A")
	var_Items.AddBar(hTask,"Task",{01/02/2001},{01/05/2001},"K1")
	hTask = var_Items.InsertItem(hSummary,,"Task B")
	var_Items.AddBar(hTask,"Task",{01/04/2001},{01/08/2001},"K2")
	hTask = var_Items.InsertItem(hSummary,,"Task C")
	var_Items.AddBar(hTask,"Task",{01/06/2001},{01/10/2001},"K3")
	' var_Items.ExpandItem(hSummary) = .t.
	oG2antt.TemplateDef = "dim var_Items,hSummary"
	oG2antt.TemplateDef = var_Items
	oG2antt.TemplateDef = hSummary
	oG2antt.Template = "var_Items.ExpandItem(hSummary) = True"

	var_Items.DefineSummaryBars(hSummary,"",-1,"<*>")
	' var_Items.ItemBar(hSummary,"",34) = 33554432
	oG2antt.TemplateDef = "dim var_Items,hSummary"
	oG2antt.TemplateDef = var_Items
	oG2antt.TemplateDef = hSummary
	oG2antt.Template = "var_Items.ItemBar(hSummary,``,34) = 33554432"

oG2antt.EndUpdate()
|